How do you graph \[x < 5\] on a number line?
Answer
564.6k+ views
Hint: A number line is an easy representation of numbers and their actual points on a graphical line.
In order to graph a number line, we need to make a horizontal line on the graph. Since in the given, the variable $x$ is less than $5$, therefore it would include all numbers less than $5$ up till $ - \infty $
Complete step-by-step solution:
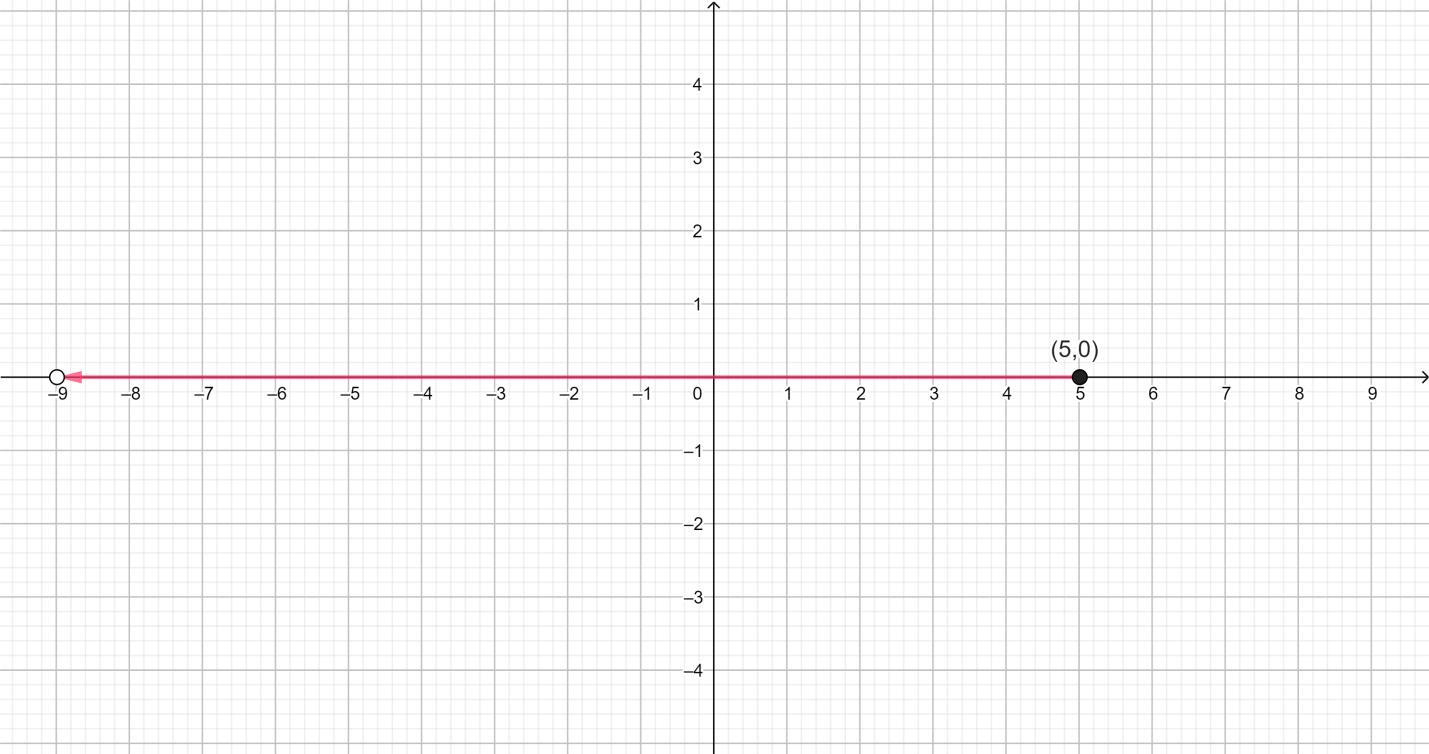
In the given $x$>$5$, thus it does not include $5$ but rather includes all the numbers ranging from 4 to $ - \infty $ Here we won’t be including \[5\], since the relation specifies that the variable $x$ is less than $5$.
In order to represent this on the number line, we shall make a line which stretches from $5$, to say, $ - 9$ for representative purposes since we cannot practically show the number line extending till $ - \infty $.

Here we will draw a hollow circle on 5 to show that it is not included in the graph.
Thus the solution is as: $[ - \infty \leqslant x < 5]$
Note: A number line is simply a line which is mapped on a graph to show different numbers at regular intervals.
The right of the number $0$ (also known as the origin) represents the positive quadrant of the number line as shown in the figure above, while the left side of the origin represents the negative side of the number line.
It is advised to be careful with the relational signs : < and > as they determine what kind of a number line we would have to draw, and also signifies the kind of circle that we would need to draw on the specified number.
Filled circle signifies that the number is included in the graph, while a hollow circle determines that the number is not included in the graph.
In order to graph a number line, we need to make a horizontal line on the graph. Since in the given, the variable $x$ is less than $5$, therefore it would include all numbers less than $5$ up till $ - \infty $
Complete step-by-step solution:
In the given $x$>$5$, thus it does not include $5$ but rather includes all the numbers ranging from 4 to $ - \infty $ Here we won’t be including \[5\], since the relation specifies that the variable $x$ is less than $5$.
In order to represent this on the number line, we shall make a line which stretches from $5$, to say, $ - 9$ for representative purposes since we cannot practically show the number line extending till $ - \infty $.

Here we will draw a hollow circle on 5 to show that it is not included in the graph.
Thus the solution is as: $[ - \infty \leqslant x < 5]$
Note: A number line is simply a line which is mapped on a graph to show different numbers at regular intervals.
The right of the number $0$ (also known as the origin) represents the positive quadrant of the number line as shown in the figure above, while the left side of the origin represents the negative side of the number line.
It is advised to be careful with the relational signs : < and > as they determine what kind of a number line we would have to draw, and also signifies the kind of circle that we would need to draw on the specified number.
Filled circle signifies that the number is included in the graph, while a hollow circle determines that the number is not included in the graph.
Recently Updated Pages
Master Class 10 Computer Science: Engaging Questions & Answers for Success

Master Class 10 General Knowledge: Engaging Questions & Answers for Success

Master Class 10 English: Engaging Questions & Answers for Success

Master Class 10 Social Science: Engaging Questions & Answers for Success

Master Class 10 Maths: Engaging Questions & Answers for Success

Master Class 10 Science: Engaging Questions & Answers for Success

Trending doubts
What is the median of the first 10 natural numbers class 10 maths CBSE

Which women's tennis player has 24 Grand Slam singles titles?

Who is the Brand Ambassador of Incredible India?

Why is there a time difference of about 5 hours between class 10 social science CBSE

Write a letter to the principal requesting him to grant class 10 english CBSE

A moving boat is observed from the top of a 150 m high class 10 maths CBSE


