


How do you graph \[x = 6\] by plotting points?
Answer
558.3k+ views
Hint:Here, the value of \[x\] is constant so we will take any arbitrary value of \[y\] and find the coordinate points. Then we will plot \[x\] and\[y\] points as a coordinate pair in the x-y axis and finally, we will connect all the points to get the required graph.
Complete step-by-step answer:
As given to us we have to plot the\[x = 6\] graph.
So the value of \[x\] is 6 and is constant.
Next, we will take random arbitrary points for \[y\] as for any value of \[y\],\[x\] will be constant. So,
\[y \in \left( { - 4, - 3, - 2, - 1,0,1,2,3,4} \right)\]
Now, we will write the coordinate pair of the points as
So, we get the coordinate points from above and now we will plot the points in the \[x - y\] axis.
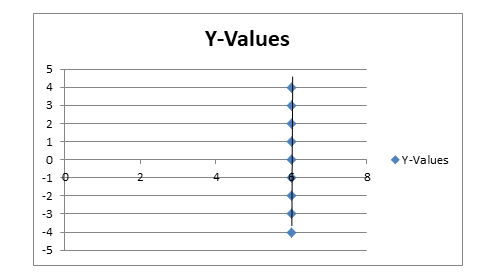
Therefore, we get the graph of \[x = 6\] as a straight line vertical to the \[y\]-axis. This is because the value of \[x\] is constant for any value of \[y\].
Note: Graphs are used to represent data or show values in an organized manner by pictorial representation or by a diagram. The points on the graph represent the relationship between one or more things. A graph consists of two-axis i.e.\[x\] axis and \[y\] axis which are extended to the positive and negative axis. The point at which these two intersect is known as the origin. There are many types of graphs and some of them are Line graphs, bar graphs, histograms and pie charts, etc. When two variables are given to us in any equation we form the points which satisfy the equation and they are plotted in the x-y axis to get a graph.
Complete step-by-step answer:
As given to us we have to plot the\[x = 6\] graph.
So the value of \[x\] is 6 and is constant.
Next, we will take random arbitrary points for \[y\] as for any value of \[y\],\[x\] will be constant. So,
\[y \in \left( { - 4, - 3, - 2, - 1,0,1,2,3,4} \right)\]
Now, we will write the coordinate pair of the points as
| \[x\] | \[6\] | \[6\] | \[6\] | \[6\] | \[6\] | \[6\] | \[6\] | \[6\] | \[6\] |
| \[y\] | \[ - 5\] | \[ - 4\] | \[ - 3\] | \[ - 2\] | \[ - 1\] | \[0\] | \[1\] | \[2\] | \[3\] |
So, we get the coordinate points from above and now we will plot the points in the \[x - y\] axis.
Therefore, we get the graph of \[x = 6\] as a straight line vertical to the \[y\]-axis. This is because the value of \[x\] is constant for any value of \[y\].
Note: Graphs are used to represent data or show values in an organized manner by pictorial representation or by a diagram. The points on the graph represent the relationship between one or more things. A graph consists of two-axis i.e.\[x\] axis and \[y\] axis which are extended to the positive and negative axis. The point at which these two intersect is known as the origin. There are many types of graphs and some of them are Line graphs, bar graphs, histograms and pie charts, etc. When two variables are given to us in any equation we form the points which satisfy the equation and they are plotted in the x-y axis to get a graph.

Recently Updated Pages
Master Class 8 Social Science: Engaging Questions & Answers for Success
Master Class 8 English: Engaging Questions & Answers for Success
Class 8 Question and Answer - Your Ultimate Solutions Guide
Master Class 8 Maths: Engaging Questions & Answers for Success
Master Class 8 Science: Engaging Questions & Answers for Success
Master Class 9 General Knowledge: Engaging Questions & Answers for Success
Trending doubts
What is BLO What is the full form of BLO class 8 social science CBSE
Citizens of India can vote at the age of A 18 years class 8 social science CBSE
Full form of STD, ISD and PCO
Advantages and disadvantages of science
Right to vote is a AFundamental Right BFundamental class 8 social science CBSE
What are the 12 elements of nature class 8 chemistry CBSE