


How do you graph $y - 2x = 0$ by plotting points?
Answer
556.5k+ views
Hint: We can draw a graph by taking many points that satisfy the equation. Here we will take five points that satisfy the equation $y - 2x = 0$ and then plot them in the graph paper. In the end, we will join the points and will get the graph.
Complete step-by-step solution:
At first, we will take the equation $y - 2x = 0$ .
We can write it as $y = 2x$ .
Now we will choose five values for $y$ and then w.r.t. the values of $y$ we will find the values of $x$ .
Let us take the values $2$ , $10$ , $0$ , $ - 4$ and $ - 10$ of $y$ .
When $y = 2$ ;
From the given equation;
$2x = 2$
$ \Rightarrow x = 1$
When $y = 10$ ;
From the given equation;
$2x = 10$
$ \Rightarrow x = 5$
When $y = 0$ ;
From the given equation;
$2x = 0$
$ \Rightarrow x = 0$
When $y = - 4$ ;
From the given equation;
$2x = - 4$
$ \Rightarrow x = - 2$
When $y = - 10$ ;
From the given equation;
$2x = - 10$
$ \Rightarrow x = - 5$
So, we get the points to plot and the points are $(1,2)$ , $(5,10)$ , $(0,0)$ , $( - 2, - 4)$ and $( - 5, - 10)$ .
Now to plot this point we have to take the basic coordinate system such that $(0,0)$ as O and two perpendicular lines XOX’ and YOY’ passing through the point origin O.
Now we will plot these points and will get this graph;
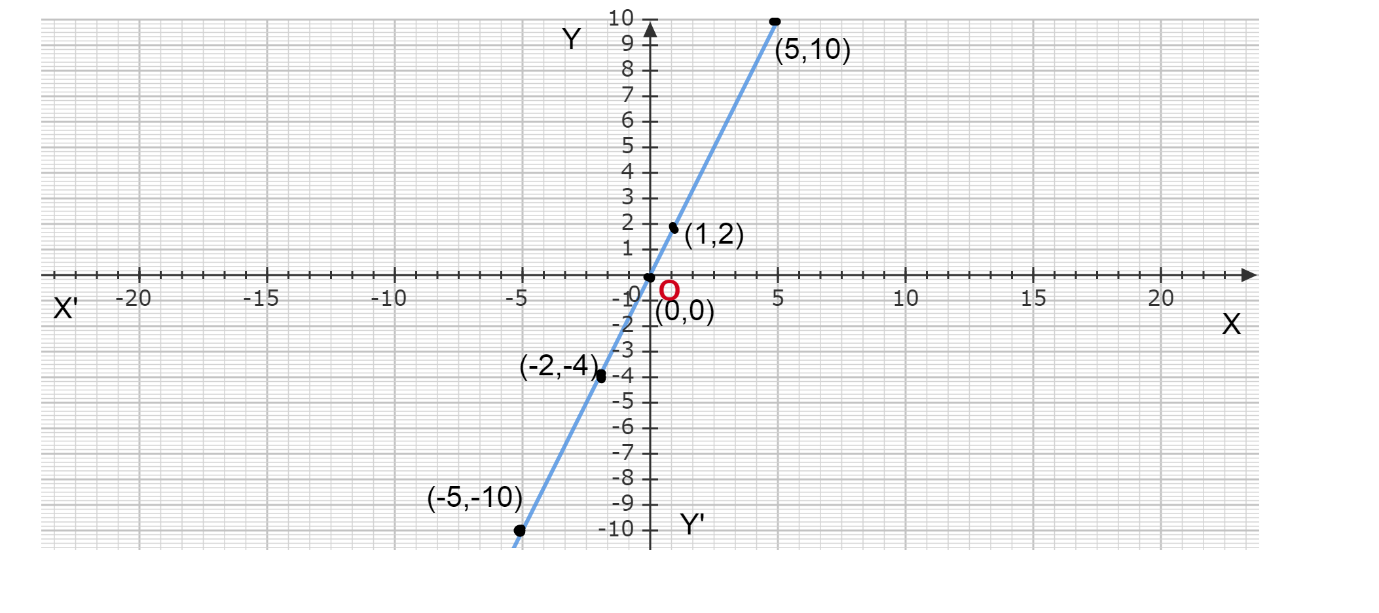
Clearly, this is a graph of the given equation $y - 2x = 0$ and the equation is of a straight line passing through the origin $(0,0)$ .
Note: Students try to take a minimum of three points to plot any graphs. As much as you have taken the points your graph will be appropriate more. In the case of plotting a curve, the process is not the same as for the straight-line cause it may happen in between or except the three points the curve changed its path. Do not forget to mention the axes and the origin.
Complete step-by-step solution:
At first, we will take the equation $y - 2x = 0$ .
We can write it as $y = 2x$ .
Now we will choose five values for $y$ and then w.r.t. the values of $y$ we will find the values of $x$ .
Let us take the values $2$ , $10$ , $0$ , $ - 4$ and $ - 10$ of $y$ .
When $y = 2$ ;
From the given equation;
$2x = 2$
$ \Rightarrow x = 1$
When $y = 10$ ;
From the given equation;
$2x = 10$
$ \Rightarrow x = 5$
When $y = 0$ ;
From the given equation;
$2x = 0$
$ \Rightarrow x = 0$
When $y = - 4$ ;
From the given equation;
$2x = - 4$
$ \Rightarrow x = - 2$
When $y = - 10$ ;
From the given equation;
$2x = - 10$
$ \Rightarrow x = - 5$
So, we get the points to plot and the points are $(1,2)$ , $(5,10)$ , $(0,0)$ , $( - 2, - 4)$ and $( - 5, - 10)$ .
Now to plot this point we have to take the basic coordinate system such that $(0,0)$ as O and two perpendicular lines XOX’ and YOY’ passing through the point origin O.
Now we will plot these points and will get this graph;
Clearly, this is a graph of the given equation $y - 2x = 0$ and the equation is of a straight line passing through the origin $(0,0)$ .
Note: Students try to take a minimum of three points to plot any graphs. As much as you have taken the points your graph will be appropriate more. In the case of plotting a curve, the process is not the same as for the straight-line cause it may happen in between or except the three points the curve changed its path. Do not forget to mention the axes and the origin.
Recently Updated Pages
Master Class 8 Social Science: Engaging Questions & Answers for Success
Master Class 8 English: Engaging Questions & Answers for Success
Class 8 Question and Answer - Your Ultimate Solutions Guide
Master Class 8 Maths: Engaging Questions & Answers for Success
Master Class 8 Science: Engaging Questions & Answers for Success
Master Class 9 General Knowledge: Engaging Questions & Answers for Success
Trending doubts
What is BLO What is the full form of BLO class 8 social science CBSE
Citizens of India can vote at the age of A 18 years class 8 social science CBSE
Full form of STD, ISD and PCO
Advantages and disadvantages of science
Right to vote is a AFundamental Right BFundamental class 8 social science CBSE
What are the 12 elements of nature class 8 chemistry CBSE