


How do you graph $y - 4x = 0$ by plotting points?
Answer
543.3k+ views
Hint: We are given a linear equation in terms of two variable quantities namely x and y and we have to graph it. On putting random values of x, we can get random values of y and thus find the coordinates of one of the points lying on the line. To plot the graph of a straight line we must know the coordinates of at least two points lying on the line so we put the value of both x and y zero one by one and then find the value of other variables from the equation of the line. We can obtain the line on the graph by joining these points.
Complete step by step solution:
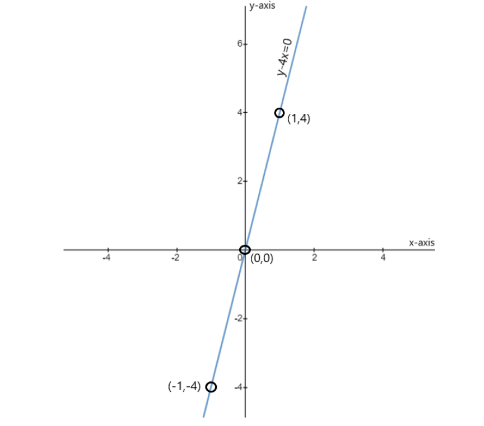
The equation of the line is $y - 4x = 0$
When $x = 0$
$
y - 4(0) = 0 \\
\Rightarrow y = 0 \;
$
Thus the line passes through the origin.
When $x = 1$
$
y - 4(1) = 0 \\
\Rightarrow y = 4 \;
$
We can trace the line of the equation $y - 4x = 0$ by joining these two points and then extending the obtained line away in the opposite directions.
Note: A graph shows the relation between two variable quantities, it contains two axes perpendicular to each other namely the x-axis and the y-axis. Each variable is measured along one of the axes. In the question, we are given one linear equation containing two variables namely x and y, x is measured along the x-axis and y is measured along the y-axis while tracing the given equations. To find the equation of a line, we must know the coordinates of at least two of the points lying on the line. We are given the equation of a line in the question so we had to find the coordinates using the given equation.
Complete step by step solution:
The equation of the line is $y - 4x = 0$
When $x = 0$
$
y - 4(0) = 0 \\
\Rightarrow y = 0 \;
$
Thus the line passes through the origin.
When $x = 1$
$
y - 4(1) = 0 \\
\Rightarrow y = 4 \;
$
We can trace the line of the equation $y - 4x = 0$ by joining these two points and then extending the obtained line away in the opposite directions.
Note: A graph shows the relation between two variable quantities, it contains two axes perpendicular to each other namely the x-axis and the y-axis. Each variable is measured along one of the axes. In the question, we are given one linear equation containing two variables namely x and y, x is measured along the x-axis and y is measured along the y-axis while tracing the given equations. To find the equation of a line, we must know the coordinates of at least two of the points lying on the line. We are given the equation of a line in the question so we had to find the coordinates using the given equation.
Recently Updated Pages
Master Class 8 Social Science: Engaging Questions & Answers for Success
Master Class 8 English: Engaging Questions & Answers for Success
Class 8 Question and Answer - Your Ultimate Solutions Guide
Master Class 8 Maths: Engaging Questions & Answers for Success
Master Class 8 Science: Engaging Questions & Answers for Success
Master Class 9 General Knowledge: Engaging Questions & Answers for Success
Trending doubts
What is BLO What is the full form of BLO class 8 social science CBSE
Citizens of India can vote at the age of A 18 years class 8 social science CBSE
Full form of STD, ISD and PCO
Advantages and disadvantages of science
Right to vote is a AFundamental Right BFundamental class 8 social science CBSE
What are the 12 elements of nature class 8 chemistry CBSE