


How do you graph y – 5x = - 2 using a table of values.
Answer
555k+ views
Hint: We are given with a linear equation in two variables. Now first we will rearrange the equation in the form y = ax + b. Now we will substitute different values of x and find corresponding different values of y. Hence we get the solutions (x, y) for the given equation. Now we will plot the point (x, y) on a graph and draw a line passing through the points. Hence we have the graph of the equation.
Complete step-by-step solution:
Now let us consider the given equation y – 5x = -2.
Transposing the term 5x to RHS we get, y = 5x – 2.
To find the table of values we will find the pairs of solutions of the equation.
Now we will substitute different values of x and find corresponding values of y.
Now let us first put x = 0 then we get, y = 5(0) – 2 Hence y = - 2.
Now let us substitute x = 1 then we get y = 5(1) – 2 Hence y = 3.
Similarly by substituting x = 2 we get y = 5(2) – 2 Hence y = 8.
Now we have the following pair of solutions.
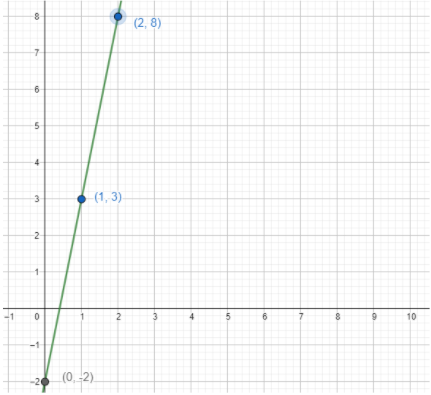
Now we will plot the points (0, -2), (1, 3) and (2, 8) on the graph. Once we have these points we will draw a line passing through all these points. Hence we have the graph of the equation
y – 5x = -2.
Hence we have the graph of the given equation.
Note: Note that only one line can be passed through two given points and to define a line minimum two points are needed. Hence we should take at least two different set of solutions while plotting the graph.
Complete step-by-step solution:
Now let us consider the given equation y – 5x = -2.
Transposing the term 5x to RHS we get, y = 5x – 2.
To find the table of values we will find the pairs of solutions of the equation.
Now we will substitute different values of x and find corresponding values of y.
Now let us first put x = 0 then we get, y = 5(0) – 2 Hence y = - 2.
Now let us substitute x = 1 then we get y = 5(1) – 2 Hence y = 3.
Similarly by substituting x = 2 we get y = 5(2) – 2 Hence y = 8.
Now we have the following pair of solutions.
| x | y |
| 0 | -2 |
| 1 | 3 |
| 2 | 8 |
Now we will plot the points (0, -2), (1, 3) and (2, 8) on the graph. Once we have these points we will draw a line passing through all these points. Hence we have the graph of the equation
y – 5x = -2.
Hence we have the graph of the given equation.
Note: Note that only one line can be passed through two given points and to define a line minimum two points are needed. Hence we should take at least two different set of solutions while plotting the graph.
Recently Updated Pages
Master Class 10 Computer Science: Engaging Questions & Answers for Success
Master Class 10 General Knowledge: Engaging Questions & Answers for Success
Master Class 10 English: Engaging Questions & Answers for Success
Master Class 10 Social Science: Engaging Questions & Answers for Success
Master Class 10 Maths: Engaging Questions & Answers for Success
Master Class 10 Science: Engaging Questions & Answers for Success
Trending doubts
What is the median of the first 10 natural numbers class 10 maths CBSE
Which women's tennis player has 24 Grand Slam singles titles?
Who is the Brand Ambassador of Incredible India?
Why is there a time difference of about 5 hours between class 10 social science CBSE
Write a letter to the principal requesting him to grant class 10 english CBSE
A moving boat is observed from the top of a 150 m high class 10 maths CBSE