


How do you graph $y = - \cot \left( {\pi \cdot x} \right)$ ?
Answer
483.3k+ views
Hint: To draw the graph of the given function, we first need to draw the graph of $y = \cot x$ .
Now, the two differences between the graphs of $\cot x$ and $ - \cot (\pi \cdot x)$ are the points where they are zero and the negative sign due to which the nature of the graph will change.
So, first we’ll try to find the points where the graph of $ - \cot (\pi \cdot x)$ is defined and zero. Then, draw the graph.
Complete step-by-step answer:
Given the function $y = - \cot (\pi \cdot x)$ and we need to draw the graph of this function.
First, we’ll see the points where $y = \cot x$ is defined.
$y = \cot x$ is defined except at the $x = 0,\pi ,2\pi ,3\pi ,...$
Using these points, we can find the points where $y = - \cot (\pi \cdot x)$ is defined.
Dividing both sides by $\pi $ , we get, $x = \dfrac{0}{\pi },\dfrac{\pi }{\pi },\dfrac{{2\pi }}{\pi },\dfrac{{3\pi }}{\pi },...$
So, the points are $x = 0,1,2,3,...$
Now, we know the points where $y = \cot x$ is zero i.e., $x = \dfrac{\pi }{2},\dfrac{{3\pi }}{2},\dfrac{{5\pi }}{2},\dfrac{{7\pi }}{2},...$
Using these points, we can find the points where $y = - \cot (\pi \cdot x)$ is zero.
We have, $\pi \cdot x = \dfrac{\pi }{2},\dfrac{{3\pi }}{2},\dfrac{{5\pi }}{2},\dfrac{{7\pi }}{2},...$ , Dividing both sides by $\pi $ , we get, $x = \dfrac{1}{2},\dfrac{3}{2},\dfrac{5}{2},\dfrac{7}{2},...$ .
So, $y = - \cot (\pi \cdot x)$ is zero when $x = \dfrac{1}{2},\dfrac{3}{2},\dfrac{5}{2},\dfrac{7}{2},...$ .
Now, we know the graph of $y = \cot x$ is as follows:
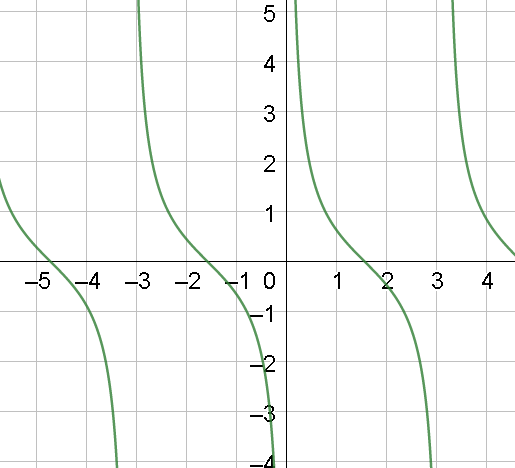
From the graph, it is clear that $y = \cot x$ is not defined when $x = 0,\pi ,2\pi ,3\pi ,...$ and is zero when $x = \dfrac{\pi }{2},\dfrac{{3\pi }}{2},\dfrac{{5\pi }}{2},\dfrac{{7\pi }}{2},...$ . Now, let’s draw the graph of $y = \cot \left( {\pi \cdot x} \right)$ which will have the same nature as that of $y = \cot x$ but the points where it is defined and where it is zero will change.
The graph of $y = \cot \left( {\pi \cdot x} \right)$ will be
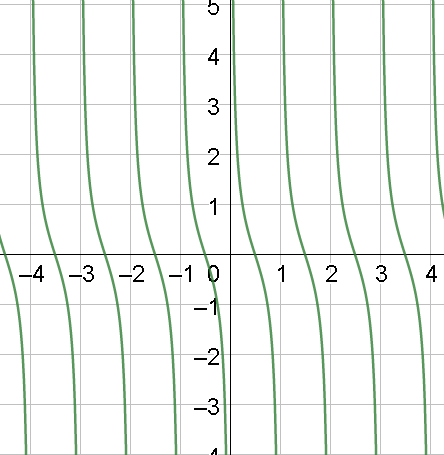
Clearly, the curve is not defined when $x = 0,1,2,3,...$ and zero when $x = \dfrac{1}{2},\dfrac{3}{2},\dfrac{5}{2},\dfrac{7}{2},...$ .
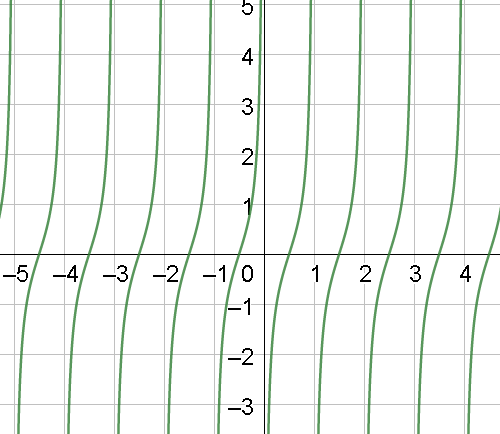
Now, the graph $y = - \cot (\pi \cdot x)$ will get reversed due to the negative sign.
Hence, the graph of $y = - \cot (\pi \cdot x)$ will be
Note: The points to be remembered while drawing the graph of the given curve are
The angle $\pi \cdot x$ which is not just $x$ , due to which the points where $\cot \left( {\pi \cdot x} \right)$ is defined and is zero will change.
And the negative sign due to which the curve gets reversed i.e., the nature of the curve will get reversed.
For graphing a complex trigonometric function, we must know the graphs of the basic trigonometric functions, which makes it easier to draw the curve of any other trigonometric function.
Now, the two differences between the graphs of $\cot x$ and $ - \cot (\pi \cdot x)$ are the points where they are zero and the negative sign due to which the nature of the graph will change.
So, first we’ll try to find the points where the graph of $ - \cot (\pi \cdot x)$ is defined and zero. Then, draw the graph.
Complete step-by-step answer:
Given the function $y = - \cot (\pi \cdot x)$ and we need to draw the graph of this function.
First, we’ll see the points where $y = \cot x$ is defined.
$y = \cot x$ is defined except at the $x = 0,\pi ,2\pi ,3\pi ,...$
Using these points, we can find the points where $y = - \cot (\pi \cdot x)$ is defined.
Dividing both sides by $\pi $ , we get, $x = \dfrac{0}{\pi },\dfrac{\pi }{\pi },\dfrac{{2\pi }}{\pi },\dfrac{{3\pi }}{\pi },...$
So, the points are $x = 0,1,2,3,...$
Now, we know the points where $y = \cot x$ is zero i.e., $x = \dfrac{\pi }{2},\dfrac{{3\pi }}{2},\dfrac{{5\pi }}{2},\dfrac{{7\pi }}{2},...$
Using these points, we can find the points where $y = - \cot (\pi \cdot x)$ is zero.
We have, $\pi \cdot x = \dfrac{\pi }{2},\dfrac{{3\pi }}{2},\dfrac{{5\pi }}{2},\dfrac{{7\pi }}{2},...$ , Dividing both sides by $\pi $ , we get, $x = \dfrac{1}{2},\dfrac{3}{2},\dfrac{5}{2},\dfrac{7}{2},...$ .
So, $y = - \cot (\pi \cdot x)$ is zero when $x = \dfrac{1}{2},\dfrac{3}{2},\dfrac{5}{2},\dfrac{7}{2},...$ .
Now, we know the graph of $y = \cot x$ is as follows:
From the graph, it is clear that $y = \cot x$ is not defined when $x = 0,\pi ,2\pi ,3\pi ,...$ and is zero when $x = \dfrac{\pi }{2},\dfrac{{3\pi }}{2},\dfrac{{5\pi }}{2},\dfrac{{7\pi }}{2},...$ . Now, let’s draw the graph of $y = \cot \left( {\pi \cdot x} \right)$ which will have the same nature as that of $y = \cot x$ but the points where it is defined and where it is zero will change.
The graph of $y = \cot \left( {\pi \cdot x} \right)$ will be
Clearly, the curve is not defined when $x = 0,1,2,3,...$ and zero when $x = \dfrac{1}{2},\dfrac{3}{2},\dfrac{5}{2},\dfrac{7}{2},...$ .
Now, the graph $y = - \cot (\pi \cdot x)$ will get reversed due to the negative sign.
Hence, the graph of $y = - \cot (\pi \cdot x)$ will be
Note: The points to be remembered while drawing the graph of the given curve are
The angle $\pi \cdot x$ which is not just $x$ , due to which the points where $\cot \left( {\pi \cdot x} \right)$ is defined and is zero will change.
And the negative sign due to which the curve gets reversed i.e., the nature of the curve will get reversed.
For graphing a complex trigonometric function, we must know the graphs of the basic trigonometric functions, which makes it easier to draw the curve of any other trigonometric function.
Recently Updated Pages
Master Class 11 Computer Science: Engaging Questions & Answers for Success
Master Class 11 Business Studies: Engaging Questions & Answers for Success
Master Class 11 Economics: Engaging Questions & Answers for Success
Master Class 11 English: Engaging Questions & Answers for Success
Master Class 11 Maths: Engaging Questions & Answers for Success
Master Class 11 Biology: Engaging Questions & Answers for Success
Trending doubts
One Metric ton is equal to kg A 10000 B 1000 C 100 class 11 physics CBSE
There are 720 permutations of the digits 1 2 3 4 5 class 11 maths CBSE
Discuss the various forms of bacteria class 11 biology CBSE
Draw a diagram of a plant cell and label at least eight class 11 biology CBSE
State the laws of reflection of light
Explain zero factorial class 11 maths CBSE