


How do I graph a rose curve?
Answer
551.1k+ views
Hint: In this question, we are supposed to show how a rose curve can be done on a graph, and we will solve this with the help of polar equation. We know that the 2-D polar coordinates are \[P\left( {r,\theta } \right),{\text{ }}r{\text{ }} = \;\sqrt {{x^2} + {y^2}} \geqslant 0\]
Complete step by step answer:
The 2-D polar coordinates \[P\left( {r,\theta } \right),{\text{ }}r{\text{ }} = \;\sqrt {{x^2} + {y^2}} \geqslant 0\] It represents length of the position vector \[ < r,\theta > \].θ determines the direction. It increases for anticlockwise motion of P about the pole O.
For clockwise rotation, it decreases. Unlike \[r,\;\theta \;\] admit negative values.
\[r\]-negative tabular values can be used by artists only.
The polar equation of a rose curve is either \[r = a\cos n\theta \] or\[r = a\sin n\theta \]
\[n\] is at your choice. Integer values \[2,{\text{ }}3,{\text{ }}4..\]are preferred for easy counting of the number of petals, in a period. \[n{\text{ }} = {\text{ }}1\]gives 1-petal circle.
To be called a rose, $n$ has to be sufficiently large and integer $ + $ a fraction, for images looking like a rose.
The number of petals for the period $[0,2\dfrac{\pi }{n}]$ will be $n$ or $2n$ (including r-negative $n$ petals) according as $n$ is odd or even, for \[0 \leqslant \theta \leqslant 2\pi \]. Of course, I maintain that $r$ is length \[ \geqslant 0,\] and so non-negative. For Quantum Physicists, \[r{\text{ }} > {\text{ }}0\].
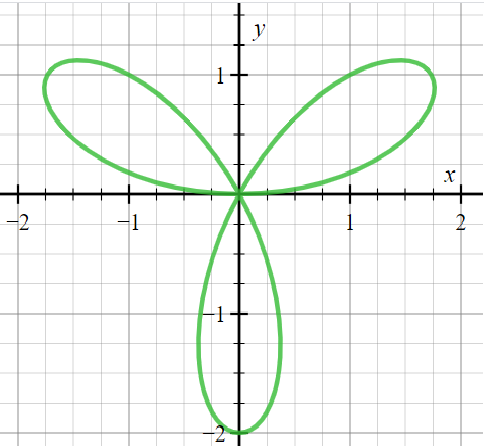
For example, consider\[r = 2\sin 3\theta \]. The period is $2\dfrac{\pi }{3}$ and the number of petals will be $3$.
In continuous drawing, R-positive and r-negative petals are drawn alternately. When n is odd, r-negative petals are same as r-positive ones. So, the total count here is 3.
Prepare a table for \[\left( {r,\theta } \right)\], in one period $[0,2\dfrac{\pi }{3}]$, for \[\theta = 0,\dfrac{\pi }{{12}},2\dfrac{\pi }{{12}},3\dfrac{\pi }{{12}},...8\dfrac{\pi }{{12}}\]. Join the points by smooth curves, befittingly. You get one petal. You ought to get the three petals for \[0 \leqslant \theta \leqslant 2\pi ..\]
For\[r = \cos 3\theta \], the petals rotate through half-petal angle $ = \dfrac{\pi }{6}$, in the clockwise sense.
A sample graph is made for \[r = 4\cos 6\theta \], using the Cartesian equivalent.
It is r-positive \[6\]-petal rose, for \[0 \leqslant \theta \leqslant 2\pi \].
Graph ${({x^2} + {y^2})^3} \times 5 - 4({x^6} - 15{x^2}{y^2}({x^2} - {y^2}) - {y^6}) = 0$
Note: In mathematics, a rose or rhodonea curve is a sinusoid plotted in polar coordinates.
For integer values, the petals might be redrawn, when the drawing is repeated over successive periods.
The period of both \[\sin n\theta \] and \[\cos n\theta \] is $2\dfrac{\pi }{n}$.
Complete step by step answer:
The 2-D polar coordinates \[P\left( {r,\theta } \right),{\text{ }}r{\text{ }} = \;\sqrt {{x^2} + {y^2}} \geqslant 0\] It represents length of the position vector \[ < r,\theta > \].θ determines the direction. It increases for anticlockwise motion of P about the pole O.
For clockwise rotation, it decreases. Unlike \[r,\;\theta \;\] admit negative values.
\[r\]-negative tabular values can be used by artists only.
The polar equation of a rose curve is either \[r = a\cos n\theta \] or\[r = a\sin n\theta \]
\[n\] is at your choice. Integer values \[2,{\text{ }}3,{\text{ }}4..\]are preferred for easy counting of the number of petals, in a period. \[n{\text{ }} = {\text{ }}1\]gives 1-petal circle.
To be called a rose, $n$ has to be sufficiently large and integer $ + $ a fraction, for images looking like a rose.
The number of petals for the period $[0,2\dfrac{\pi }{n}]$ will be $n$ or $2n$ (including r-negative $n$ petals) according as $n$ is odd or even, for \[0 \leqslant \theta \leqslant 2\pi \]. Of course, I maintain that $r$ is length \[ \geqslant 0,\] and so non-negative. For Quantum Physicists, \[r{\text{ }} > {\text{ }}0\].
For example, consider\[r = 2\sin 3\theta \]. The period is $2\dfrac{\pi }{3}$ and the number of petals will be $3$.
In continuous drawing, R-positive and r-negative petals are drawn alternately. When n is odd, r-negative petals are same as r-positive ones. So, the total count here is 3.
Prepare a table for \[\left( {r,\theta } \right)\], in one period $[0,2\dfrac{\pi }{3}]$, for \[\theta = 0,\dfrac{\pi }{{12}},2\dfrac{\pi }{{12}},3\dfrac{\pi }{{12}},...8\dfrac{\pi }{{12}}\]. Join the points by smooth curves, befittingly. You get one petal. You ought to get the three petals for \[0 \leqslant \theta \leqslant 2\pi ..\]
For\[r = \cos 3\theta \], the petals rotate through half-petal angle $ = \dfrac{\pi }{6}$, in the clockwise sense.
A sample graph is made for \[r = 4\cos 6\theta \], using the Cartesian equivalent.
It is r-positive \[6\]-petal rose, for \[0 \leqslant \theta \leqslant 2\pi \].
Graph ${({x^2} + {y^2})^3} \times 5 - 4({x^6} - 15{x^2}{y^2}({x^2} - {y^2}) - {y^6}) = 0$
Note: In mathematics, a rose or rhodonea curve is a sinusoid plotted in polar coordinates.
For integer values, the petals might be redrawn, when the drawing is repeated over successive periods.
The period of both \[\sin n\theta \] and \[\cos n\theta \] is $2\dfrac{\pi }{n}$.
Recently Updated Pages
Master Class 11 Computer Science: Engaging Questions & Answers for Success
Master Class 11 Business Studies: Engaging Questions & Answers for Success
Master Class 11 Economics: Engaging Questions & Answers for Success
Master Class 11 English: Engaging Questions & Answers for Success
Master Class 11 Maths: Engaging Questions & Answers for Success
Master Class 11 Biology: Engaging Questions & Answers for Success
Trending doubts
One Metric ton is equal to kg A 10000 B 1000 C 100 class 11 physics CBSE
There are 720 permutations of the digits 1 2 3 4 5 class 11 maths CBSE
Discuss the various forms of bacteria class 11 biology CBSE
Draw a diagram of a plant cell and label at least eight class 11 biology CBSE
State the laws of reflection of light
Explain zero factorial class 11 maths CBSE