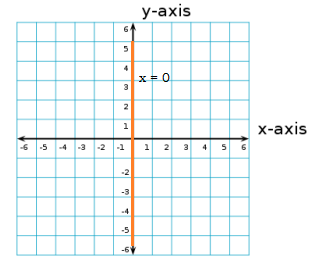
How do you draw the graph of \[x=0\] ?
Answer
561k+ views
Hint:
In the given question, we have been asked to graph the line \[x=0\] . Now, this line is going to be parallel to the y-axis. Hence, that means that its y-coordinate is going to be constant ($0$ in this case). The given value of the x-coordinate is how far the line from the y-axis is.
Complete step by step solution:
First, to solve such types of questions, we need to draw the x-axis and the y-axis on the graph. The x-axis is simply the horizontal axis in the graph and the y-axis is the vertical one. To draw the graph of \[x=0\] , we need to find the points which lie on \[x=0\] .
The graph of \[x=0\] will include all points for which x-coordinate is 0. Therefore, points \[(0,0)\] , \[(0,1)\] , \[(0,-1)\] , \[(0,2)\] , \[(0,-2)\] etc. are the required points.
Now, let’s plot these points in the graph

The highlighted line represents \[x=0\] on the graph.
Note:
While solving this question, many students misinterpret \[x=0\] as a line in which y-coordinates of all points is $0$. But it is actually a line in which the x-coordinate of all points is 0. \[x=0\] is a line whose distance from the y-axis is $0$.
In the given question, we have been asked to graph the line \[x=0\] . Now, this line is going to be parallel to the y-axis. Hence, that means that its y-coordinate is going to be constant ($0$ in this case). The given value of the x-coordinate is how far the line from the y-axis is.
Complete step by step solution:
First, to solve such types of questions, we need to draw the x-axis and the y-axis on the graph. The x-axis is simply the horizontal axis in the graph and the y-axis is the vertical one. To draw the graph of \[x=0\] , we need to find the points which lie on \[x=0\] .
The graph of \[x=0\] will include all points for which x-coordinate is 0. Therefore, points \[(0,0)\] , \[(0,1)\] , \[(0,-1)\] , \[(0,2)\] , \[(0,-2)\] etc. are the required points.
Now, let’s plot these points in the graph

The highlighted line represents \[x=0\] on the graph.
Note:
While solving this question, many students misinterpret \[x=0\] as a line in which y-coordinates of all points is $0$. But it is actually a line in which the x-coordinate of all points is 0. \[x=0\] is a line whose distance from the y-axis is $0$.
Recently Updated Pages
Master Class 10 Computer Science: Engaging Questions & Answers for Success

Master Class 10 General Knowledge: Engaging Questions & Answers for Success

Master Class 10 English: Engaging Questions & Answers for Success

Master Class 10 Social Science: Engaging Questions & Answers for Success

Master Class 10 Maths: Engaging Questions & Answers for Success

Master Class 10 Science: Engaging Questions & Answers for Success

Trending doubts
What is the median of the first 10 natural numbers class 10 maths CBSE

Which women's tennis player has 24 Grand Slam singles titles?

Who is the Brand Ambassador of Incredible India?

Why is there a time difference of about 5 hours between class 10 social science CBSE

Write a letter to the principal requesting him to grant class 10 english CBSE

A moving boat is observed from the top of a 150 m high class 10 maths CBSE


