


How do you draw the graph of \[y=x-3\] ?
Answer
561k+ views
Hint:
For drawing the graph of a linear equation, we just need to plot two points satisfying the given linear equation. This can be done by randomly selecting $2$ values for x and find the values of y corresponding to the selected values of x.
Complete step by step solution:
First, to solve such types of questions, we need to draw the x-axis and the y-axis on the graph. The x-axis is simply the horizontal axis in the graph and the y-axis is the vertical one
To draw the graph of \[y=x-3\] , we need to find the points which lie on \[y=x-3\] .
In the graph of \[y=x-3\] :
On putting, \[x=0\],
We get, \[y=0-3=(-3)\] .
Therefore, the point \[(0,-3)\] will lie on the graph.
Now, on putting, \[y=0\] ,
We get, \[0=x-3\Rightarrow x=3\] .
Therefore, the point \[(3,0)\] will lie on the graph.
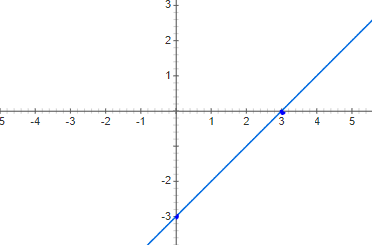
From the above calculations, we found that the graph will include \[(3,0)\] and \[(0,-3)\] .
Now, let’s plot these points in the graph:
Note:
While solving such questions, it is recommended to select points for which one of the coordinates is $0$. This will help in simplifying the calculations. Graph of a linear equation is a straight line, therefore, finding only $2$ points is sufficient.
For drawing the graph of a linear equation, we just need to plot two points satisfying the given linear equation. This can be done by randomly selecting $2$ values for x and find the values of y corresponding to the selected values of x.
Complete step by step solution:
First, to solve such types of questions, we need to draw the x-axis and the y-axis on the graph. The x-axis is simply the horizontal axis in the graph and the y-axis is the vertical one
To draw the graph of \[y=x-3\] , we need to find the points which lie on \[y=x-3\] .
In the graph of \[y=x-3\] :
On putting, \[x=0\],
We get, \[y=0-3=(-3)\] .
Therefore, the point \[(0,-3)\] will lie on the graph.
Now, on putting, \[y=0\] ,
We get, \[0=x-3\Rightarrow x=3\] .
Therefore, the point \[(3,0)\] will lie on the graph.
From the above calculations, we found that the graph will include \[(3,0)\] and \[(0,-3)\] .
Now, let’s plot these points in the graph:
Note:
While solving such questions, it is recommended to select points for which one of the coordinates is $0$. This will help in simplifying the calculations. Graph of a linear equation is a straight line, therefore, finding only $2$ points is sufficient.
Recently Updated Pages
Master Class 10 Computer Science: Engaging Questions & Answers for Success
Master Class 10 General Knowledge: Engaging Questions & Answers for Success
Master Class 10 English: Engaging Questions & Answers for Success
Master Class 10 Social Science: Engaging Questions & Answers for Success
Master Class 10 Maths: Engaging Questions & Answers for Success
Master Class 10 Science: Engaging Questions & Answers for Success
Trending doubts
Which women's tennis player has 24 Grand Slam singles titles?
Who is the Brand Ambassador of Incredible India?
Why is there a time difference of about 5 hours between class 10 social science CBSE
Which Country is Called "The Land of Festivals"?
What type of cell is found in the Seminiferous tub class 10 biology CBSE
What are the public facilities provided by the government? Also explain each facility