


How do you graph $3x-y<0$ ?
Answer
542.4k+ views
Hint: We first assume the inequality to be an equation and draw the line accordingly. Then, we need to take any arbitrary point not lying on the line and check if it satisfies the inequality or not and then decide accordingly which side is the required region.
Complete step by step solution:
The given inequality that we have at our disposal is,
$3x-y<0$
By the graph of an inequality, we mean a semi-infinite region with a line as its boundary on one side. The general procedure of plotting a graph of an inequality is to at first, not identify it as an inequality. By this statement, we mean to say that, we first need to draw a line by assuming an “equal to” sign in place of the inequality sign. After that, we then take a random arbitrary point on the x-y plane such that it does not line on the line formed by the equation. We substitute this point in the given inequality and see if it satisfies the given inequality or not. If it satisfies, then the side of the line corresponding to the point will be the required graphical region of the inequality. If it does not satisfy, then the other side will be a solution.
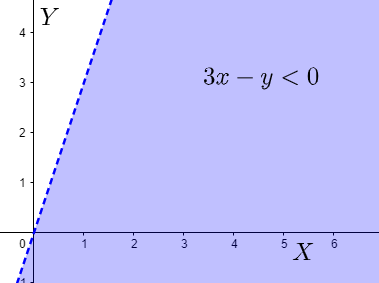
We first assume $3x-y=0$ . This will be a line passing through the origin and the point $\left( 1,3 \right)$ . Then, let us take another point, say $\left( 1,2 \right)$ and see if it lies on the line or not. We can see that it does not lie on the line. We now put this value of x and y in the expression $3x-y$ to get $3\left( 1 \right)-2=1$ . $1$ being greater than $0$ , does not satisfy the inequality and so the other side of the line will be the required region.
Note: We should choose the point wisely and then judge the respective region correctly as the entire problem depends on the region. There is no other way than this to solve the problem, which forces us to be more cautious in this problem.
Complete step by step solution:
The given inequality that we have at our disposal is,
$3x-y<0$
By the graph of an inequality, we mean a semi-infinite region with a line as its boundary on one side. The general procedure of plotting a graph of an inequality is to at first, not identify it as an inequality. By this statement, we mean to say that, we first need to draw a line by assuming an “equal to” sign in place of the inequality sign. After that, we then take a random arbitrary point on the x-y plane such that it does not line on the line formed by the equation. We substitute this point in the given inequality and see if it satisfies the given inequality or not. If it satisfies, then the side of the line corresponding to the point will be the required graphical region of the inequality. If it does not satisfy, then the other side will be a solution.
We first assume $3x-y=0$ . This will be a line passing through the origin and the point $\left( 1,3 \right)$ . Then, let us take another point, say $\left( 1,2 \right)$ and see if it lies on the line or not. We can see that it does not lie on the line. We now put this value of x and y in the expression $3x-y$ to get $3\left( 1 \right)-2=1$ . $1$ being greater than $0$ , does not satisfy the inequality and so the other side of the line will be the required region.
Note: We should choose the point wisely and then judge the respective region correctly as the entire problem depends on the region. There is no other way than this to solve the problem, which forces us to be more cautious in this problem.
Recently Updated Pages
Master Class 11 Computer Science: Engaging Questions & Answers for Success
Master Class 11 Business Studies: Engaging Questions & Answers for Success
Master Class 11 Economics: Engaging Questions & Answers for Success
Master Class 11 English: Engaging Questions & Answers for Success
Master Class 11 Maths: Engaging Questions & Answers for Success
Master Class 11 Biology: Engaging Questions & Answers for Success
Trending doubts
One Metric ton is equal to kg A 10000 B 1000 C 100 class 11 physics CBSE
There are 720 permutations of the digits 1 2 3 4 5 class 11 maths CBSE
Discuss the various forms of bacteria class 11 biology CBSE
Draw a diagram of a plant cell and label at least eight class 11 biology CBSE
State the laws of reflection of light
Explain zero factorial class 11 maths CBSE