


How do you graph a function y = 10x.
Answer
555k+ views
Hint: Now to draw the graph of the function we will first find solutions to the given equation. To do so we will substitute distinct values of x and find the corresponding values of y. Now we will plot the point (x, y) and hence draw a line passing through all points. Hence we have the graph of the given equation.
Complete step-by-step answer:
Now consider the given equation y = 10x.
This is a linear equation in two variables
To plot the graph of this equation we will find some of the solutions of the equations.
Now to find the solution we will substitute different values of x and get corresponding values of y.
Now first let us substitute x = 0. Hence we get y = 10(0) = 0
Now let us substitute x = 1. Hence we get, y = 10(1) = 10.
Now again substituting x = 2 we get y = 10(2) = 20.
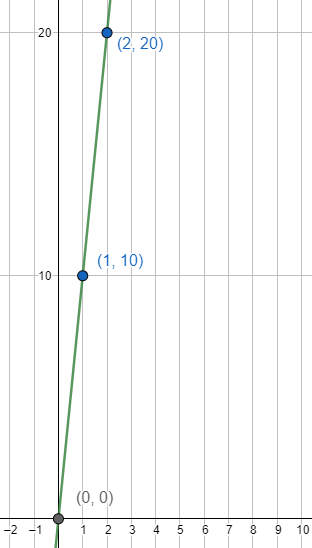
Hence we can say that (0, 0), (1, 10) and (2, 20) are the solution to the given equation.
Now to draw the graph of the given equation we will plot the following points on a graph and then draw a line passing through all the points.
Hence we get the graphs as
Note: Note that all the linear equations are of the for ax + by = c. When we have c = 0 the line passes through origin and hence the x and y intercept of the lines are 0. Now note that to draw a line we need just two points and hence if we have two solutions to the equation we can easily draw the graph of the equation as the linear equation always represents a straight line.
Complete step-by-step answer:
Now consider the given equation y = 10x.
This is a linear equation in two variables
To plot the graph of this equation we will find some of the solutions of the equations.
Now to find the solution we will substitute different values of x and get corresponding values of y.
Now first let us substitute x = 0. Hence we get y = 10(0) = 0
Now let us substitute x = 1. Hence we get, y = 10(1) = 10.
Now again substituting x = 2 we get y = 10(2) = 20.
Hence we can say that (0, 0), (1, 10) and (2, 20) are the solution to the given equation.
Now to draw the graph of the given equation we will plot the following points on a graph and then draw a line passing through all the points.
Hence we get the graphs as
Note: Note that all the linear equations are of the for ax + by = c. When we have c = 0 the line passes through origin and hence the x and y intercept of the lines are 0. Now note that to draw a line we need just two points and hence if we have two solutions to the equation we can easily draw the graph of the equation as the linear equation always represents a straight line.
Recently Updated Pages
Master Class 10 Computer Science: Engaging Questions & Answers for Success
Master Class 10 General Knowledge: Engaging Questions & Answers for Success
Master Class 10 English: Engaging Questions & Answers for Success
Master Class 10 Social Science: Engaging Questions & Answers for Success
Master Class 10 Maths: Engaging Questions & Answers for Success
Master Class 10 Science: Engaging Questions & Answers for Success
Trending doubts
What is the median of the first 10 natural numbers class 10 maths CBSE
Which women's tennis player has 24 Grand Slam singles titles?
Who is the Brand Ambassador of Incredible India?
Why is there a time difference of about 5 hours between class 10 social science CBSE
Write a letter to the principal requesting him to grant class 10 english CBSE
A moving boat is observed from the top of a 150 m high class 10 maths CBSE