


How do you graph negative cosine?
Answer
558.6k+ views
Hint:
To draw the graph of the negative of cosine first draw the cosine graph then translate the graph . remember that negative cosine and cosine of negative angle are different. Because cosine of negative angle is positive means $\cos \left( { - \theta } \right) = \cos \left( \theta \right)$ but negative cosine is negative value of the cosine function that is $ - \cos \left( {\dfrac{\pi }{3}} \right) = - 0.5$.
Complete step by step solution:
The objective of the problem is to draw the graph of negative cosine.
For that consider the interval $\left[ { - 2\pi ,2\pi } \right]$ and draw the graph of negative cosine in the interval $\left[ { - 2\pi ,2\pi } \right]$ and observe the pattern.
Draw the graph of negative cosine using graphing software
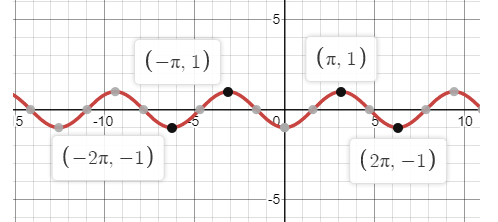
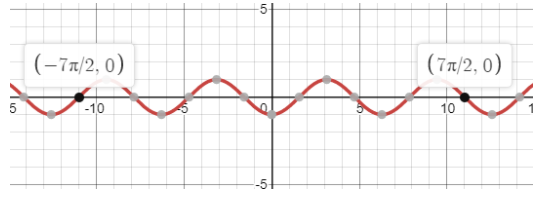
From the graph observe that the range of negative cosine is $\left[ { - 1,1} \right]$ and at every multiple of $\dfrac{\pi }{2}$ intersect the x-axis at zero and at every multiple of pi reaches one. At zero it reaches -1. This happens in every interval. Using this pattern we can extend the graph of negative sine for every segment .
The graph of negative cosine will be like this using graphing software.
Note:
The graph of negative cosine is the transpose of the graph of cosine. These waves are called sinusoidal waves. The value of cosine lies between minus one to plus one. The period of the cosine function is two pi. And for the sine function the period is also the same as the cosine function. And the values of sine function lies between minus one and plus one. Tan function period is pi.
To draw the graph of the negative of cosine first draw the cosine graph then translate the graph . remember that negative cosine and cosine of negative angle are different. Because cosine of negative angle is positive means $\cos \left( { - \theta } \right) = \cos \left( \theta \right)$ but negative cosine is negative value of the cosine function that is $ - \cos \left( {\dfrac{\pi }{3}} \right) = - 0.5$.
Complete step by step solution:
The objective of the problem is to draw the graph of negative cosine.
For that consider the interval $\left[ { - 2\pi ,2\pi } \right]$ and draw the graph of negative cosine in the interval $\left[ { - 2\pi ,2\pi } \right]$ and observe the pattern.
| $\theta $ | $ - 2\pi $ | $ - \dfrac{{3\pi }}{2}$ | $ - \pi $ | $ - \dfrac{\pi }{2}$ | $0$ | $\dfrac{\pi }{2}$ | $\pi $ | $\dfrac{{3\pi }}{2}$ | $2\pi $ |
| $\cos \theta $ | 1 | 0 | -1 | 0 | 1 | 0 | -1 | 0 | 1 |
| $ - \cos \theta $ | -1 | 0 | 1 | 0 | -1 | 0 | 1 | 0 | -1 |
Draw the graph of negative cosine using graphing software
From the graph observe that the range of negative cosine is $\left[ { - 1,1} \right]$ and at every multiple of $\dfrac{\pi }{2}$ intersect the x-axis at zero and at every multiple of pi reaches one. At zero it reaches -1. This happens in every interval. Using this pattern we can extend the graph of negative sine for every segment .
The graph of negative cosine will be like this using graphing software.
Note:
The graph of negative cosine is the transpose of the graph of cosine. These waves are called sinusoidal waves. The value of cosine lies between minus one to plus one. The period of the cosine function is two pi. And for the sine function the period is also the same as the cosine function. And the values of sine function lies between minus one and plus one. Tan function period is pi.
Recently Updated Pages
Master Class 10 Computer Science: Engaging Questions & Answers for Success
Master Class 10 General Knowledge: Engaging Questions & Answers for Success
Master Class 10 English: Engaging Questions & Answers for Success
Master Class 10 Social Science: Engaging Questions & Answers for Success
Master Class 10 Maths: Engaging Questions & Answers for Success
Master Class 10 Science: Engaging Questions & Answers for Success
Trending doubts
What is the median of the first 10 natural numbers class 10 maths CBSE
Which women's tennis player has 24 Grand Slam singles titles?
Who is the Brand Ambassador of Incredible India?
Why is there a time difference of about 5 hours between class 10 social science CBSE
Write a letter to the principal requesting him to grant class 10 english CBSE
A moving boat is observed from the top of a 150 m high class 10 maths CBSE