


How do you graph $r=\theta $ ?
Answer
533.4k+ views
Hint: We know that $\left( r,\theta \right)$ are polar coordinates, where r is the distance between the point and origin and $\theta $ is the angle between the line joining the origin and the point on X-axis. We will start substituting the value of $\theta $ from zero and increase gradually to find the desired answer.
Complete step by step solution:
We have given an expression $r=\theta $.
We have to plot a graph for the given equation.
Now, we know that $\left( r,\theta \right)$ are polar coordinates, where r is the distance between the point and origin and $\theta $ is the angle between the line joining the origin and the point on X-axis.
Now, we know that the value of $\theta $ starts from zero i.e. from origin and goes in the counter clockwise direction. The graph goes curved when the value of $\theta $ increases.
When the value of $\theta $ increases from $0\text{ to }\dfrac{\pi }{2}$ the graph goes in the counterclockwise direction and farther from the origin because the Cartesian coordinates will be
$\Rightarrow x=r\cos \theta $ and $y=r\sin \theta $
When $\theta =\dfrac{\pi }{2}$ we will get
$\Rightarrow x=r\cos \dfrac{\pi }{2}$ and $y=r\sin \dfrac{\pi }{2}$
$\Rightarrow x=\dfrac{\pi }{2}\times 0$ and $y=\dfrac{\pi }{2}\times 1$
$\Rightarrow x=0$ and $y=\dfrac{\pi }{2}$
So the graph intercepts the Y-axis at $\dfrac{\pi }{2}$.
Similarly when $\theta $ increases from to $\pi $ the graph intercepts X-axis at $\pi $.
We will get the graph as
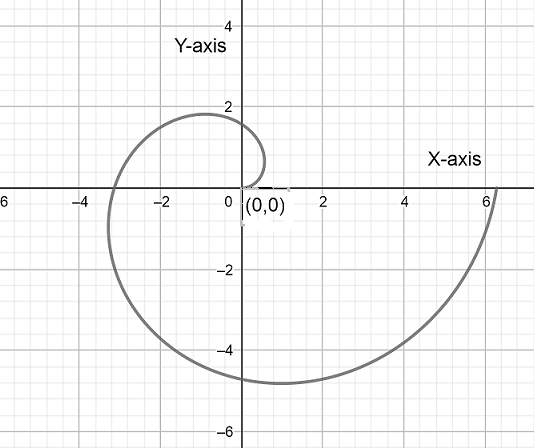
Hence above is the required graph of the given expression.
Note: To plot a graph first we need to find the values of Cartesian coordinates. Then by finding some values of points we will draw a graph. We need to write r and $\theta $ in terms of x and y to plot a graph in a Cartesian plane.
Complete step by step solution:
We have given an expression $r=\theta $.
We have to plot a graph for the given equation.
Now, we know that $\left( r,\theta \right)$ are polar coordinates, where r is the distance between the point and origin and $\theta $ is the angle between the line joining the origin and the point on X-axis.
Now, we know that the value of $\theta $ starts from zero i.e. from origin and goes in the counter clockwise direction. The graph goes curved when the value of $\theta $ increases.
When the value of $\theta $ increases from $0\text{ to }\dfrac{\pi }{2}$ the graph goes in the counterclockwise direction and farther from the origin because the Cartesian coordinates will be
$\Rightarrow x=r\cos \theta $ and $y=r\sin \theta $
When $\theta =\dfrac{\pi }{2}$ we will get
$\Rightarrow x=r\cos \dfrac{\pi }{2}$ and $y=r\sin \dfrac{\pi }{2}$
$\Rightarrow x=\dfrac{\pi }{2}\times 0$ and $y=\dfrac{\pi }{2}\times 1$
$\Rightarrow x=0$ and $y=\dfrac{\pi }{2}$
So the graph intercepts the Y-axis at $\dfrac{\pi }{2}$.
Similarly when $\theta $ increases from to $\pi $ the graph intercepts X-axis at $\pi $.
We will get the graph as
Hence above is the required graph of the given expression.
Note: To plot a graph first we need to find the values of Cartesian coordinates. Then by finding some values of points we will draw a graph. We need to write r and $\theta $ in terms of x and y to plot a graph in a Cartesian plane.
Recently Updated Pages
Master Class 11 Computer Science: Engaging Questions & Answers for Success
Master Class 11 Business Studies: Engaging Questions & Answers for Success
Master Class 11 Economics: Engaging Questions & Answers for Success
Master Class 11 English: Engaging Questions & Answers for Success
Master Class 11 Maths: Engaging Questions & Answers for Success
Master Class 11 Biology: Engaging Questions & Answers for Success
Trending doubts
One Metric ton is equal to kg A 10000 B 1000 C 100 class 11 physics CBSE
There are 720 permutations of the digits 1 2 3 4 5 class 11 maths CBSE
Discuss the various forms of bacteria class 11 biology CBSE
Draw a diagram of a plant cell and label at least eight class 11 biology CBSE
State the laws of reflection of light
Explain zero factorial class 11 maths CBSE