


How do you graph the function y = logx?
Answer
562.8k+ views
Hint: In this question, we need to graph the function y = logx. Since no base is given so we will consider it as 10 and draw the graph for $y={{\log }_{10}}x$. For this, we will first find the asymptote of function by putting the argument of the function (angle of the log) as zero. The graph will run along the asymptote. After that, we will take some values of x and find values of y to find points that can be drawn on the graph. Using these points we will draw a smooth curve and obtain the required graph.
Complete step by step answer:
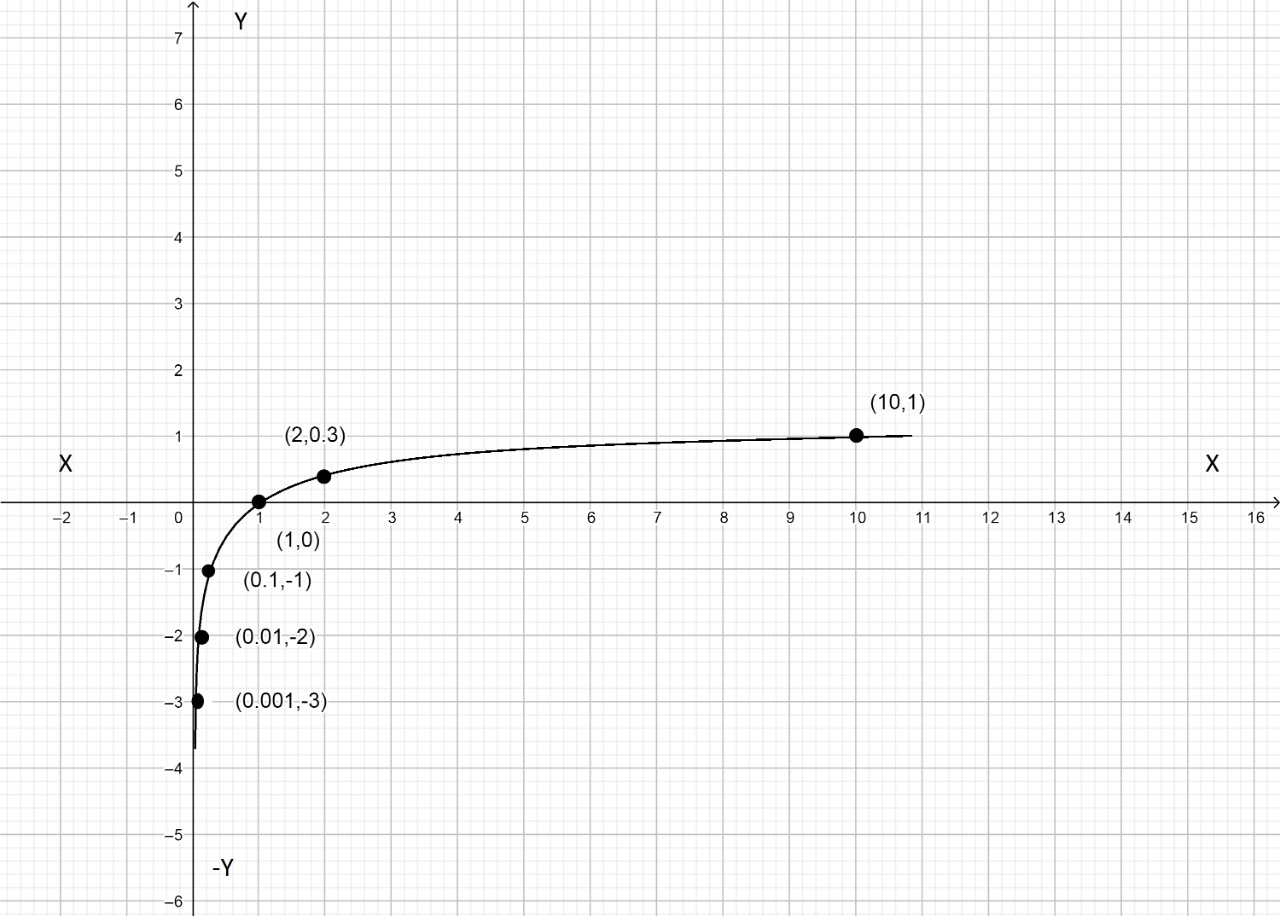
Here we are given the function as y = logx. We need to plot a graph for this function. Here we are not given any base for logarithm so we will assume the base as 10 and draw the graph for $y={{\log }_{10}}x$.
Let us first find the equation of the line of asymptote so that we properly graph our function running along the asymptote.
For finding asymptote we need to put the argument of the logarithm as zero (angle of the log). Here we have x = 0.
So equation of asymptote is x = 0.
Now let us find some points to plot.
For x = 1 we have $y={{\log }_{10}}1=0$.
For x = 2 we have $y={{\log }_{10}}2=0.301$.
For x = 10 we have $y={{\log }_{10}}10=1$.
For $x=\dfrac{1}{10}=0.1$ we have $y={{\log }_{10}}{{\left( 10 \right)}^{-1}}=-1$.
For $x=\dfrac{1}{100}=0.01$ we have $y={{\log }_{10}}{{\left( 10 \right)}^{-2}}=-2$.
For $x=\dfrac{1}{1000}=0.001$ we have $y={{\log }_{10}}{{\left( 10 \right)}^{-3}}=-3$.
Our point table becomes
Plotting these points on the graph and taking care of asymptote our graph looks like this,
Note:
Students should note that x cannot be negative. Also, log0 does not exist. Take care while plotting the points on the graph. If the base of the logarithmic function is different our graph changes. The general shape remains the same.
Complete step by step answer:
Here we are given the function as y = logx. We need to plot a graph for this function. Here we are not given any base for logarithm so we will assume the base as 10 and draw the graph for $y={{\log }_{10}}x$.
Let us first find the equation of the line of asymptote so that we properly graph our function running along the asymptote.
For finding asymptote we need to put the argument of the logarithm as zero (angle of the log). Here we have x = 0.
So equation of asymptote is x = 0.
Now let us find some points to plot.
For x = 1 we have $y={{\log }_{10}}1=0$.
For x = 2 we have $y={{\log }_{10}}2=0.301$.
For x = 10 we have $y={{\log }_{10}}10=1$.
For $x=\dfrac{1}{10}=0.1$ we have $y={{\log }_{10}}{{\left( 10 \right)}^{-1}}=-1$.
For $x=\dfrac{1}{100}=0.01$ we have $y={{\log }_{10}}{{\left( 10 \right)}^{-2}}=-2$.
For $x=\dfrac{1}{1000}=0.001$ we have $y={{\log }_{10}}{{\left( 10 \right)}^{-3}}=-3$.
Our point table becomes
| x | $\dfrac{1}{1000}$ | $\dfrac{1}{100}$ | $\dfrac{1}{10}$ | 1 | 10 |
| y | -3 | -2 | -1 | 0 | 1 |
Plotting these points on the graph and taking care of asymptote our graph looks like this,
Note:
Students should note that x cannot be negative. Also, log0 does not exist. Take care while plotting the points on the graph. If the base of the logarithmic function is different our graph changes. The general shape remains the same.
Recently Updated Pages
Master Class 10 Computer Science: Engaging Questions & Answers for Success
Master Class 10 General Knowledge: Engaging Questions & Answers for Success
Master Class 10 English: Engaging Questions & Answers for Success
Master Class 10 Social Science: Engaging Questions & Answers for Success
Master Class 10 Maths: Engaging Questions & Answers for Success
Master Class 10 Science: Engaging Questions & Answers for Success
Trending doubts
What is the median of the first 10 natural numbers class 10 maths CBSE
Which women's tennis player has 24 Grand Slam singles titles?
Who is the Brand Ambassador of Incredible India?
Why is there a time difference of about 5 hours between class 10 social science CBSE
Write a letter to the principal requesting him to grant class 10 english CBSE
State and prove converse of BPT Basic Proportionality class 10 maths CBSE