


How do you graph the line $y = 3$?
Answer
558.6k+ views
Hint: The given equation of the line is independent of $x$ variable. Hence, we can say that this line is parallel to the $X$ axis but passing through points with constant $y$ coordinates.
Formulas used: The standard given of a line passing through a point $\left( {x,y} \right)$, $y = mx + c$, where $m$ is the slope of the line and $c$ is the $y$-intercept.
Complete step-by-step answer:
We know that,
$y = mx + c$ ------(1)
is the standard equation of a line.
Here, we are given the equation
$y = 3$-----------(2)
Comparing equations (1) and (2), we can say that,
$m = 0$ and $c = 3$.
That is, the slope of the line is zero.
$ \Rightarrow $ The line is parallel to the $X$ axis.
Also, the line has $y$-intercept at $\left( {0,3} \right)$.
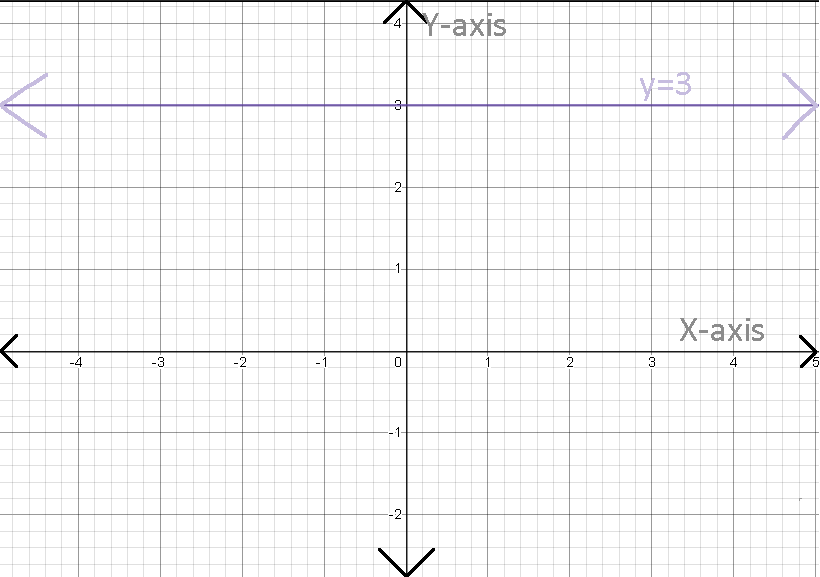
Thus, we can conclude that $y = 3$ is a line having slope zero and passing through $\left( {0,3} \right)$.
Now, let us plot the line in a graph as shown:
Additional information:
The standard equations of some special lines:
Parallel to $X$ axis: $y = a$, where $a$ is any constant.
Parallel to $Y$ axis: $x = b$, where $b$ is any constant.
Passing through the origin: $y = mx$, where $m$ is the slope of the line.
Note: The plotting of a line requires at least one of the following requirement as below:
There must be at least two distinct points.
There must be an equation of the line.
Formulas used: The standard given of a line passing through a point $\left( {x,y} \right)$, $y = mx + c$, where $m$ is the slope of the line and $c$ is the $y$-intercept.
Complete step-by-step answer:
We know that,
$y = mx + c$ ------(1)
is the standard equation of a line.
Here, we are given the equation
$y = 3$-----------(2)
Comparing equations (1) and (2), we can say that,
$m = 0$ and $c = 3$.
That is, the slope of the line is zero.
$ \Rightarrow $ The line is parallel to the $X$ axis.
Also, the line has $y$-intercept at $\left( {0,3} \right)$.
Thus, we can conclude that $y = 3$ is a line having slope zero and passing through $\left( {0,3} \right)$.
Now, let us plot the line in a graph as shown:
Additional information:
The standard equations of some special lines:
Parallel to $X$ axis: $y = a$, where $a$ is any constant.
Parallel to $Y$ axis: $x = b$, where $b$ is any constant.
Passing through the origin: $y = mx$, where $m$ is the slope of the line.
Note: The plotting of a line requires at least one of the following requirement as below:
There must be at least two distinct points.
There must be an equation of the line.
Recently Updated Pages
Master Class 10 Computer Science: Engaging Questions & Answers for Success
Master Class 10 General Knowledge: Engaging Questions & Answers for Success
Master Class 10 English: Engaging Questions & Answers for Success
Master Class 10 Social Science: Engaging Questions & Answers for Success
Master Class 10 Maths: Engaging Questions & Answers for Success
Master Class 10 Science: Engaging Questions & Answers for Success
Trending doubts
What is the median of the first 10 natural numbers class 10 maths CBSE
Which women's tennis player has 24 Grand Slam singles titles?
Who is the Brand Ambassador of Incredible India?
Why is there a time difference of about 5 hours between class 10 social science CBSE
Write a letter to the principal requesting him to grant class 10 english CBSE
A moving boat is observed from the top of a 150 m high class 10 maths CBSE