


How do you graph the line $y = 4$ ?
Answer
557.7k+ views
Hint: Compare $y = 4$ with slope intercept form $y = mx + c$ where $m$ is slope and $c$ is the $y$ intercept and plot it.
Complete step by step answer:
Slope intercept form of the equation is $y = mx + c$ where $m$ is slope and $c$ is the $y$ intercept.
Comparing $y = mx + c$ with $y = 4$
Here, $c$ is 4.
We get slope, $m = 0$ when slope $m = 0$ then the equation given is a horizontal line.
This means $x$ can take any values.
This means, point $(x,y)$ is $(0,4)$$,$$( - 3,4),( - 2,4),( - 1,4),(1,4),(2,4),(3,4)....$
Here $y$ is constant that is 4.
Mark the points in the graph $(0,4)$$,$$( - 3,4),( - 2,4),( - 1,4),(1,4),(2,4),(3,4)$
After marking join all the points, we get the horizontal line
The horizontal line is parallel to x-axis.
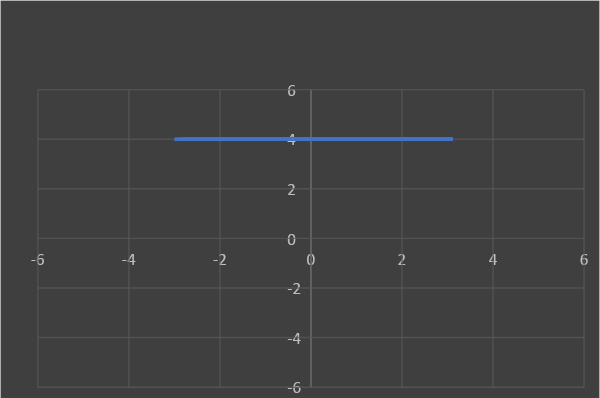
Thus, the above graph represents line $y = 4$.
Additional information:
Any straight line parallel to x-axis is given by $y = a$ where $a$ is the distance of line from the x-axis. Similarly, any straight line parallel to the y-axis is given by $x = b$ where $b$ is the distance of line from the y-axis. When equations like this come you can directly draw a parallel line for the given equation .
Note: One should know the standard equation of line that is, slope intercept form $y = mx + c$.
where $m$is slope and $c$ is the $y$ intercept.
Parallel lines are two lines in co - co-ordinate plane, which never intersects each other.
When substituting the value for variable try to list them in a table to make it easier to plot the points.
Complete step by step answer:
Slope intercept form of the equation is $y = mx + c$ where $m$ is slope and $c$ is the $y$ intercept.
Comparing $y = mx + c$ with $y = 4$
Here, $c$ is 4.
We get slope, $m = 0$ when slope $m = 0$ then the equation given is a horizontal line.
This means $x$ can take any values.
This means, point $(x,y)$ is $(0,4)$$,$$( - 3,4),( - 2,4),( - 1,4),(1,4),(2,4),(3,4)....$
Here $y$ is constant that is 4.
Mark the points in the graph $(0,4)$$,$$( - 3,4),( - 2,4),( - 1,4),(1,4),(2,4),(3,4)$
After marking join all the points, we get the horizontal line
The horizontal line is parallel to x-axis.
Thus, the above graph represents line $y = 4$.
Additional information:
Any straight line parallel to x-axis is given by $y = a$ where $a$ is the distance of line from the x-axis. Similarly, any straight line parallel to the y-axis is given by $x = b$ where $b$ is the distance of line from the y-axis. When equations like this come you can directly draw a parallel line for the given equation .
Note: One should know the standard equation of line that is, slope intercept form $y = mx + c$.
where $m$is slope and $c$ is the $y$ intercept.
Parallel lines are two lines in co - co-ordinate plane, which never intersects each other.
When substituting the value for variable try to list them in a table to make it easier to plot the points.
Recently Updated Pages
Master Class 11 Computer Science: Engaging Questions & Answers for Success
Master Class 11 Business Studies: Engaging Questions & Answers for Success
Master Class 11 Economics: Engaging Questions & Answers for Success
Master Class 11 English: Engaging Questions & Answers for Success
Master Class 11 Maths: Engaging Questions & Answers for Success
Master Class 11 Biology: Engaging Questions & Answers for Success
Trending doubts
One Metric ton is equal to kg A 10000 B 1000 C 100 class 11 physics CBSE
There are 720 permutations of the digits 1 2 3 4 5 class 11 maths CBSE
Discuss the various forms of bacteria class 11 biology CBSE
Draw a diagram of a plant cell and label at least eight class 11 biology CBSE
State the laws of reflection of light
Explain zero factorial class 11 maths CBSE