


How do you graph \[x = - 5\]?
Answer
557.1k+ views
Hint: In the above question we are given an equation that is \[x = - 5\] and we are asked how to draw the graph of the equation. For which we would first check if the equation provided to us is in the simplest form or not. If not we would simplify that then we would proceed further to draw its graph by finding the points that satisfy the equation provided to us in the question for the graph.
Complete step-by-step answer:
So here we are provided with an equation \[x = - 5\] and we are asked how we would graph this equation.
Now for drawing the graph of any equation we need to check for the points satisfying the equation and which would help in the plotting of the graph. For the points we need to check first if the given equation is its simplest form or not if not we would make it into its simpler form.
So for the given equation that is \[x = - 5\] the simplest form is provided to us with.
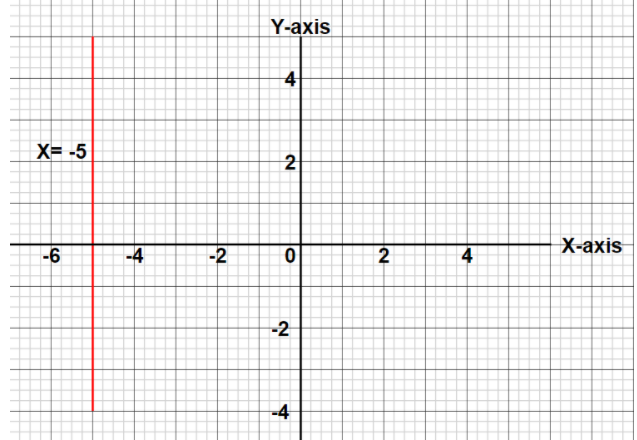
Now we can see from the given equation that it has only \[x\] component and the\[y\] is missing which means that the graph of the given equation \[x = - 5\] would be line parallel to the \[y\] axis situated in the second quadrant
Now plotting the graph of the equation\[x = - 5\] is as shown below –
Note: In these types of questions we should know how to reduce the equation and how to solve it to get its simplest form out easily and correctly. Luckily here the equation was already in its simplest form so no difficulty was there. Also the care should be taken while plotting the line of the graph of these equations as an error there can cost u whole question being wrong.
Complete step-by-step answer:
So here we are provided with an equation \[x = - 5\] and we are asked how we would graph this equation.
Now for drawing the graph of any equation we need to check for the points satisfying the equation and which would help in the plotting of the graph. For the points we need to check first if the given equation is its simplest form or not if not we would make it into its simpler form.
So for the given equation that is \[x = - 5\] the simplest form is provided to us with.
Now we can see from the given equation that it has only \[x\] component and the\[y\] is missing which means that the graph of the given equation \[x = - 5\] would be line parallel to the \[y\] axis situated in the second quadrant
Now plotting the graph of the equation\[x = - 5\] is as shown below –
Note: In these types of questions we should know how to reduce the equation and how to solve it to get its simplest form out easily and correctly. Luckily here the equation was already in its simplest form so no difficulty was there. Also the care should be taken while plotting the line of the graph of these equations as an error there can cost u whole question being wrong.
Recently Updated Pages
Master Class 8 Social Science: Engaging Questions & Answers for Success
Master Class 8 English: Engaging Questions & Answers for Success
Class 8 Question and Answer - Your Ultimate Solutions Guide
Master Class 8 Maths: Engaging Questions & Answers for Success
Master Class 8 Science: Engaging Questions & Answers for Success
Master Class 9 General Knowledge: Engaging Questions & Answers for Success
Trending doubts
What is BLO What is the full form of BLO class 8 social science CBSE
Citizens of India can vote at the age of A 18 years class 8 social science CBSE
Full form of STD, ISD and PCO
Advantages and disadvantages of science
Right to vote is a AFundamental Right BFundamental class 8 social science CBSE
What are the 12 elements of nature class 8 chemistry CBSE