


How do you graph $ x - y = 6 $ ?
Answer
561.9k+ views
Hint: Here in this given equation first we rearrange the equation shift the variable x to the RHS keep y in LHS now give the values to the x like 0, 1, 2, 3, … simultaneously we get the values of y. Now we get the coordinates of the given equation i.e., (x,y) by using the coordinates to construct the graph. We assign the value of x and we determine the value of y and we plot the graph.
Complete step-by-step answer:
Given equation in the form of linear equation in the form of two variables x and y
Consider the equation $ x - y = 6 $
For this equation, we first solve the equation by starting with moving the x in the equation to the other side i.e., RHS or subtracting x on both side, we get
$ - y = 6 - x $
In the above equation 2 variables x and y are there
By giving the x values 0, 1, 2, 3, … simultaneously we get the values of y
Put x=0
Then $ \Rightarrow \, - y = 6 - 0 $
$ \therefore \,\,\,y = - 6 $
Therefore, coordinate $ \left( {x,y} \right) = \left( {0, - 6} \right) $
Put x=2
$ \Rightarrow \, - y = 6 - 2 $
$ \therefore \,\,\,y = - 4 $
Therefore, coordinate $ \left( {x,y} \right) = \left( {2, - 4} \right) $
Put x=4
$ \Rightarrow \, - y = 6 - 4 $
$ \therefore \,\,\,y = - 2 $
Therefore, coordinate $ \left( {x,y} \right) = \left( {4, - 2} \right) $
Put x=6
$ \Rightarrow \, - y = 6 - 6 $
$ \therefore \,\,\,y = 0 $
Therefore, coordinate $ \left( {x,y} \right) = \left( {6,0} \right) $
Put x=8
$ \Rightarrow \, - y = 6 - 8 $
$ \therefore \,\,\,y = 2 $
Therefore, coordinate $ \left( {x,y} \right) = \left( {8,2} \right) $
And so on
The coordinates can be written in table as :
Now, the graph of the given linear equation $ x - y = 6 $ by using the above table as follows:
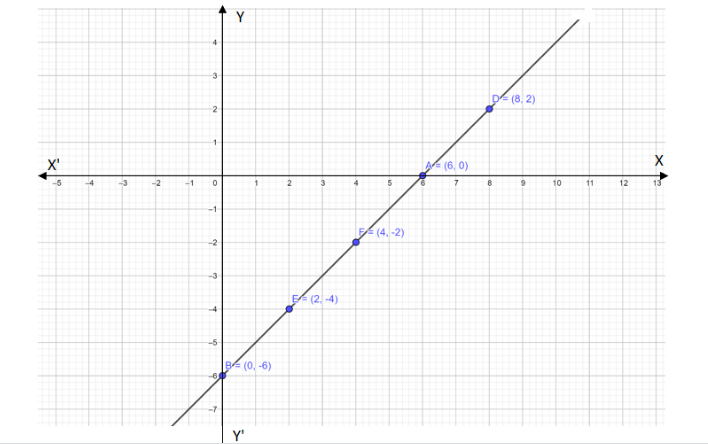
Note: The graph is plotted x-axis versus y axis. The graph is two dimensional. By the given equation write it for y and consider it as a graph equation. By the equation of a graph, we can plot the graph by assuming the value of x. we can’t assume the value of y. because the value of y depends on the value of x. Hence, we have plotted the graph.
Complete step-by-step answer:
Given equation in the form of linear equation in the form of two variables x and y
Consider the equation $ x - y = 6 $
For this equation, we first solve the equation by starting with moving the x in the equation to the other side i.e., RHS or subtracting x on both side, we get
$ - y = 6 - x $
In the above equation 2 variables x and y are there
By giving the x values 0, 1, 2, 3, … simultaneously we get the values of y
Put x=0
Then $ \Rightarrow \, - y = 6 - 0 $
$ \therefore \,\,\,y = - 6 $
Therefore, coordinate $ \left( {x,y} \right) = \left( {0, - 6} \right) $
Put x=2
$ \Rightarrow \, - y = 6 - 2 $
$ \therefore \,\,\,y = - 4 $
Therefore, coordinate $ \left( {x,y} \right) = \left( {2, - 4} \right) $
Put x=4
$ \Rightarrow \, - y = 6 - 4 $
$ \therefore \,\,\,y = - 2 $
Therefore, coordinate $ \left( {x,y} \right) = \left( {4, - 2} \right) $
Put x=6
$ \Rightarrow \, - y = 6 - 6 $
$ \therefore \,\,\,y = 0 $
Therefore, coordinate $ \left( {x,y} \right) = \left( {6,0} \right) $
Put x=8
$ \Rightarrow \, - y = 6 - 8 $
$ \therefore \,\,\,y = 2 $
Therefore, coordinate $ \left( {x,y} \right) = \left( {8,2} \right) $
And so on
The coordinates can be written in table as :
| $ x $ | $ 0 $ | $ 2 $ | $ 4 $ | $ 6 $ | $ 8 $ |
| $ y $ | $ - 6 $ | $ - 4 $ | $ - 2 $ | $ 0 $ | $ 2 $ |
| $ \left( {x,y} \right) $ | $ \left( {0, - 6} \right) $ | $ \left( {2, - 4} \right) $ | $ \left( {4, - 2} \right) $ | $ \left( {6,0} \right) $ | $ \left( {8,2} \right) $ |
Now, the graph of the given linear equation $ x - y = 6 $ by using the above table as follows:
Note: The graph is plotted x-axis versus y axis. The graph is two dimensional. By the given equation write it for y and consider it as a graph equation. By the equation of a graph, we can plot the graph by assuming the value of x. we can’t assume the value of y. because the value of y depends on the value of x. Hence, we have plotted the graph.

Recently Updated Pages
Master Class 8 Social Science: Engaging Questions & Answers for Success
Master Class 8 English: Engaging Questions & Answers for Success
Class 8 Question and Answer - Your Ultimate Solutions Guide
Master Class 8 Maths: Engaging Questions & Answers for Success
Master Class 8 Science: Engaging Questions & Answers for Success
Master Class 9 General Knowledge: Engaging Questions & Answers for Success
Trending doubts
What is BLO What is the full form of BLO class 8 social science CBSE
Citizens of India can vote at the age of A 18 years class 8 social science CBSE
Full form of STD, ISD and PCO
Advantages and disadvantages of science
Right to vote is a AFundamental Right BFundamental class 8 social science CBSE
What are the 12 elements of nature class 8 chemistry CBSE