


How do you graph $ y = 1.5x $ ?
Answer
561.6k+ views
Hint: Here we have to plot a graph. In this given equation by giving the values to the x like 0, 1, 2, 3, … simultaneously we get the values of y with respect to the x value. after getting the x and y values, write the coordinates of the given equation in the form of (x,y), by using the coordinates to construct the required graph of the given equation.
Complete step-by-step answer:
Given equation in the form of linear equation in the form of two variables x and y
Consider the equation $ y = 1.5x $
Now, by giving the x values 0, 1, 2, 3, … to the above equation simultaneously we get the values of y
When we substitute the value of x=0
Then $ \Rightarrow \,\,y = 1.5\left( 0 \right) $
$ \therefore \,\,\,y = 0 $
Therefore, coordinate $ \left( {x,y} \right) = \left( {0,0} \right) $
When we substitute the value of x=2
$ \Rightarrow \,y = 1.5\left( 2 \right) $
$ \therefore \,\,\,y = 3 $
Therefore, coordinate $ \left( {x,y} \right) = \left( {2,3} \right) $
When we substitute the value of x=4
$ \Rightarrow \,y = 1.5\left( 4 \right) $
$ \therefore \,\,\,y = 6 $
Therefore, coordinate $ \left( {x,y} \right) = \left( {4,6} \right) $
When we substitute the value of x=6
$ \Rightarrow \,y = 1.5\left( 6 \right) $
$ \therefore \,\,\,y = 9 $
Therefore, coordinate $ \left( {x,y} \right) = \left( {6,9} \right) $
When we substitute the value of x=8
$ \Rightarrow \,y = 1.5\left( 8 \right) $
$ \therefore \,\,\,y = 12 $
Therefore, coordinate $ \left( {x,y} \right) = \left( {8,12} \right) $
And so on …
Hence by substituting the value of x we have determined some of the values or points we use to plot the graph.
The coordinates can be written in table as :
Now, the graph of the given linear equation $ y = 1.5x $ by using the above table as follows:
Note: The graph is plotted x-axis versus y axis. The graph is two dimensional. By the given equation write it for y and consider it as a graph equation. By the equation of a graph, we can plot the graph by assuming the value of x. We can’t assume the value of y. because the value of y depends on the value of x. hence, we have plotted the graph.
Complete step-by-step answer:
Given equation in the form of linear equation in the form of two variables x and y
Consider the equation $ y = 1.5x $
Now, by giving the x values 0, 1, 2, 3, … to the above equation simultaneously we get the values of y
When we substitute the value of x=0
Then $ \Rightarrow \,\,y = 1.5\left( 0 \right) $
$ \therefore \,\,\,y = 0 $
Therefore, coordinate $ \left( {x,y} \right) = \left( {0,0} \right) $
When we substitute the value of x=2
$ \Rightarrow \,y = 1.5\left( 2 \right) $
$ \therefore \,\,\,y = 3 $
Therefore, coordinate $ \left( {x,y} \right) = \left( {2,3} \right) $
When we substitute the value of x=4
$ \Rightarrow \,y = 1.5\left( 4 \right) $
$ \therefore \,\,\,y = 6 $
Therefore, coordinate $ \left( {x,y} \right) = \left( {4,6} \right) $
When we substitute the value of x=6
$ \Rightarrow \,y = 1.5\left( 6 \right) $
$ \therefore \,\,\,y = 9 $
Therefore, coordinate $ \left( {x,y} \right) = \left( {6,9} \right) $
When we substitute the value of x=8
$ \Rightarrow \,y = 1.5\left( 8 \right) $
$ \therefore \,\,\,y = 12 $
Therefore, coordinate $ \left( {x,y} \right) = \left( {8,12} \right) $
And so on …
Hence by substituting the value of x we have determined some of the values or points we use to plot the graph.
The coordinates can be written in table as :
| $ x $ | $ 0 $ | $ 2 $ | $ 4 $ | $ 6 $ | $ 8 $ |
| $ y $ | $ 0 $ | $ 3 $ | $ 6 $ | $ 9 $ | $ 12 $ |
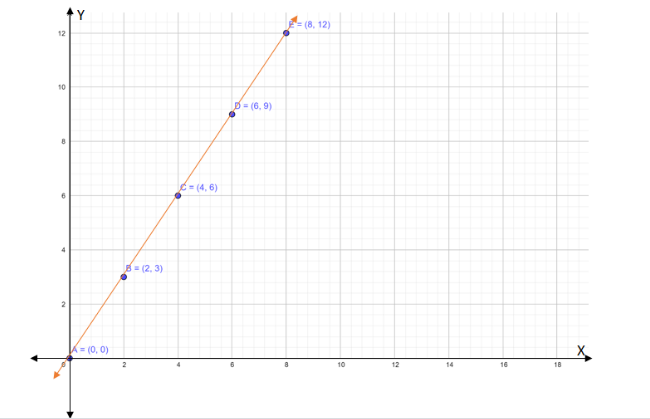
| $ \left( {x,y} \right) $ | $ \left( {0,0} \right) $ | $ \left( {2,3} \right) $ | $ \left( {4,6} \right) $ | $ \left( {6,9} \right) $ | $ \left( {8,12} \right) $ |
Now, the graph of the given linear equation $ y = 1.5x $ by using the above table as follows:
Note: The graph is plotted x-axis versus y axis. The graph is two dimensional. By the given equation write it for y and consider it as a graph equation. By the equation of a graph, we can plot the graph by assuming the value of x. We can’t assume the value of y. because the value of y depends on the value of x. hence, we have plotted the graph.
Recently Updated Pages
Master Class 8 Social Science: Engaging Questions & Answers for Success
Master Class 8 English: Engaging Questions & Answers for Success
Class 8 Question and Answer - Your Ultimate Solutions Guide
Master Class 8 Maths: Engaging Questions & Answers for Success
Master Class 8 Science: Engaging Questions & Answers for Success
Master Class 7 English: Engaging Questions & Answers for Success
Trending doubts
What is BLO What is the full form of BLO class 8 social science CBSE
Citizens of India can vote at the age of A 18 years class 8 social science CBSE
Full form of STD, ISD and PCO
Advantages and disadvantages of science
Right to vote is a AFundamental Right BFundamental class 8 social science CBSE
What are the 12 elements of nature class 8 chemistry CBSE