


How do you graph \[y = 2\sin x\]?
Answer
541.5k+ views
Hint: The graph of “sinx” is already drawn whose magnitude lie between one and minus one, here the graph will remain same but the magnitude will be multiplied by two since the given question is given to draw for “2sinx” hence the graph will remain in same way only the magnitude will be twice the original one.
Complete step-by-step answer:
Here we have to draw the graph for “sinx” and whose magnitude will be twice the original one, the original graph of “sinx” is drawn between one and minus one on the y axis and the curve moves according to the values on different angle, here the graph drawn will be as for the original graph of “sinx” only the magnitude will be twice the original one, hence the graph drawn will be between two and minus two, on plotting we get;
Here we will draw the graph between minus two pie and two pie, on drawing we get:
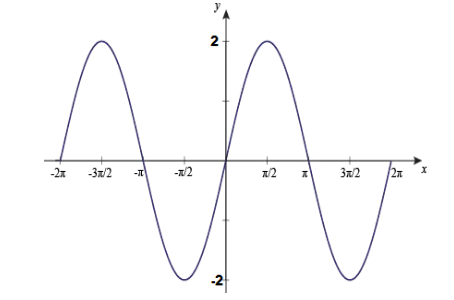
Note: The standard “sinx” curve is drawn by plotting the different values on different angle for “sinx” and then combining each value to make a curve, here we have just doubled the value as obtained in original curve because in the given question the magnitude of “sinx” is multiplied by two, therefore the graph obtained will be same as for “sinx” only the value will be multiplied by two.
Complete step-by-step answer:
Here we have to draw the graph for “sinx” and whose magnitude will be twice the original one, the original graph of “sinx” is drawn between one and minus one on the y axis and the curve moves according to the values on different angle, here the graph drawn will be as for the original graph of “sinx” only the magnitude will be twice the original one, hence the graph drawn will be between two and minus two, on plotting we get;
Here we will draw the graph between minus two pie and two pie, on drawing we get:
Note: The standard “sinx” curve is drawn by plotting the different values on different angle for “sinx” and then combining each value to make a curve, here we have just doubled the value as obtained in original curve because in the given question the magnitude of “sinx” is multiplied by two, therefore the graph obtained will be same as for “sinx” only the value will be multiplied by two.
Recently Updated Pages
Master Class 11 Computer Science: Engaging Questions & Answers for Success
Master Class 11 Business Studies: Engaging Questions & Answers for Success
Master Class 11 Economics: Engaging Questions & Answers for Success
Master Class 11 English: Engaging Questions & Answers for Success
Master Class 11 Maths: Engaging Questions & Answers for Success
Master Class 11 Biology: Engaging Questions & Answers for Success
Trending doubts
One Metric ton is equal to kg A 10000 B 1000 C 100 class 11 physics CBSE
There are 720 permutations of the digits 1 2 3 4 5 class 11 maths CBSE
Discuss the various forms of bacteria class 11 biology CBSE
Draw a diagram of a plant cell and label at least eight class 11 biology CBSE
State the laws of reflection of light
Explain zero factorial class 11 maths CBSE