


How do you graph \[y = 2x - 4\] ?
Answer
518.7k+ views
Hint: The graph of the straight line so given can be found very simply. We will put different values of x in the equation and get the values of y. Then these pairs of x and y would be plotted in the form of points on a graph paper to get the exact idea. Then on joining the points we will get the image of the line so given.
Complete step-by-step answer:
Given is the equation of a line,
\[y = 2x - 4\]
This is of the form \[y = mx + C\]
In this slope intercept form m is the slope of the line.
Now we will take four different values of x and find the value of y for it.
If x=0
\[y = 2\left( 0 \right) - 4\]
On calculating we get,
\[y = - 4\]
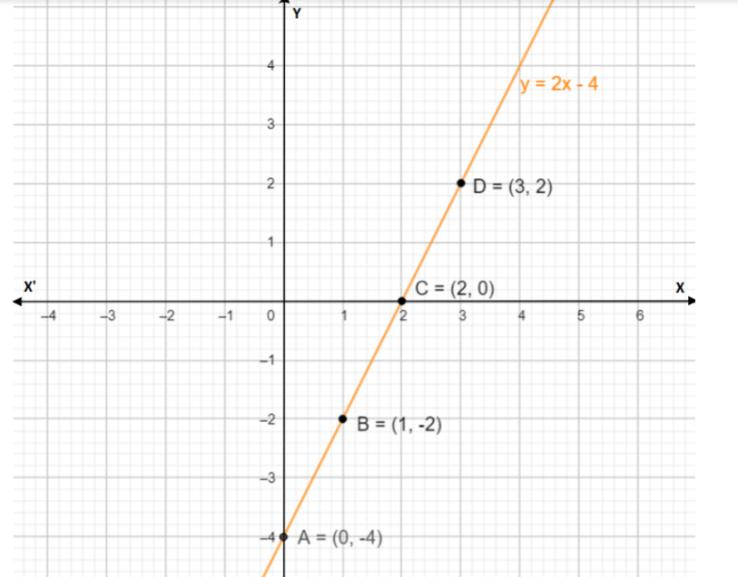
So the first point is say \[A\left( {0, - 4} \right)\]
If x=1
\[y = 2\left( 1 \right) - 4\]
On calculating we get,
\[\begin{gathered}
y = 2 - 4 \\
y = - 2 \\
\end{gathered} \]
So the second point is say \[B\left( {1, - 2} \right)\]
If x=2
\[y = 2\left( 2 \right) - 4\]
On calculating we get,
\[\begin{gathered}
y = 4 - 4 \\
y = 0 \\
\end{gathered} \]
So third point is say \[C\left( {2,0} \right)\]
Now the last point.
If x=3
\[y = 2\left( 3 \right) - 4\]
On calculating we get,
\[\begin{gathered}
y = 6 - 4 \\
y = 2 \\
\end{gathered} \]
So the last point is say \[D\left( {3,2} \right)\]
Now we will plot these points and on joining them will give a straight line.
Note: Here note that there is no such restriction on how many points to take for graphing the line. We can take them as per our convenience. But those should be more than three so that we can at least see the line.
We can also proceed with the slope. It is the ratio of difference between the y coordinates of two points to x coordinates. And the positive slope indicates the line is increasing.
Complete step-by-step answer:
Given is the equation of a line,
\[y = 2x - 4\]
This is of the form \[y = mx + C\]
In this slope intercept form m is the slope of the line.
Now we will take four different values of x and find the value of y for it.
If x=0
\[y = 2\left( 0 \right) - 4\]
On calculating we get,
\[y = - 4\]
So the first point is say \[A\left( {0, - 4} \right)\]
If x=1
\[y = 2\left( 1 \right) - 4\]
On calculating we get,
\[\begin{gathered}
y = 2 - 4 \\
y = - 2 \\
\end{gathered} \]
So the second point is say \[B\left( {1, - 2} \right)\]
If x=2
\[y = 2\left( 2 \right) - 4\]
On calculating we get,
\[\begin{gathered}
y = 4 - 4 \\
y = 0 \\
\end{gathered} \]
So third point is say \[C\left( {2,0} \right)\]
Now the last point.
If x=3
\[y = 2\left( 3 \right) - 4\]
On calculating we get,
\[\begin{gathered}
y = 6 - 4 \\
y = 2 \\
\end{gathered} \]
So the last point is say \[D\left( {3,2} \right)\]
Now we will plot these points and on joining them will give a straight line.
Note: Here note that there is no such restriction on how many points to take for graphing the line. We can take them as per our convenience. But those should be more than three so that we can at least see the line.
We can also proceed with the slope. It is the ratio of difference between the y coordinates of two points to x coordinates. And the positive slope indicates the line is increasing.

Recently Updated Pages
Master Class 8 Social Science: Engaging Questions & Answers for Success
Master Class 8 English: Engaging Questions & Answers for Success
Class 8 Question and Answer - Your Ultimate Solutions Guide
Master Class 8 Maths: Engaging Questions & Answers for Success
Master Class 8 Science: Engaging Questions & Answers for Success
Master Class 9 General Knowledge: Engaging Questions & Answers for Success
Trending doubts
What is BLO What is the full form of BLO class 8 social science CBSE
Citizens of India can vote at the age of A 18 years class 8 social science CBSE
Full form of STD, ISD and PCO
Advantages and disadvantages of science
Right to vote is a AFundamental Right BFundamental class 8 social science CBSE
What are the 12 elements of nature class 8 chemistry CBSE