


How do you graph y = 4x ?
Answer
542.7k+ views
Hint: In the given question, we have an equation in two variables. We have to plot the line on a graph which forms from this equation. Firstly convert the given equation to slope intercept form. From there, we find out the value of slope and the y- intercept. We plot a point at the y-intercept on y-axis. From there, we move up or down and then right or left depending upon the coefficient of x and y respectively, and join the points to form the line.
Complete step by step solution:
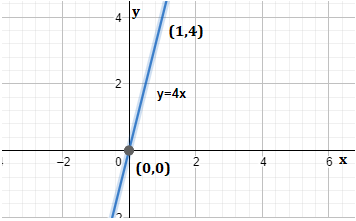
We have been given an equation y = 4x.
Clearly, this equation is of the type y = mx + c, hence, is already in the slope-intercept form.
Thus, slope m = 4 and, y-intercept c = 0
Hence, one point on the graph can be taken as (0,0).
Now,
$m=\dfrac{\text{coefficient of x }}{\text{coefficient of y } }$
Hence, we move up 1 (coefficient of y) points and then move to the right 4 (coefficient of x) points.
Thus, the second point is (0 + 1, 0 + 4) = (1, 4).
Now, we plot the two points and join them and we have our line.
Note: In this question, we only need to know how to get the points for the graph and then, how to plot the points on the graph. Then we just calculate the values from the equation, plot them on the graph, join the points on the graph and we get the line which marks the required equation.
Complete step by step solution:
We have been given an equation y = 4x.
Clearly, this equation is of the type y = mx + c, hence, is already in the slope-intercept form.
Thus, slope m = 4 and, y-intercept c = 0
Hence, one point on the graph can be taken as (0,0).
Now,
$m=\dfrac{\text{coefficient of x }}{\text{coefficient of y } }$
Hence, we move up 1 (coefficient of y) points and then move to the right 4 (coefficient of x) points.
Thus, the second point is (0 + 1, 0 + 4) = (1, 4).
Now, we plot the two points and join them and we have our line.
Note: In this question, we only need to know how to get the points for the graph and then, how to plot the points on the graph. Then we just calculate the values from the equation, plot them on the graph, join the points on the graph and we get the line which marks the required equation.
Recently Updated Pages
Master Class 10 Computer Science: Engaging Questions & Answers for Success
Master Class 10 General Knowledge: Engaging Questions & Answers for Success
Master Class 10 English: Engaging Questions & Answers for Success
Master Class 10 Social Science: Engaging Questions & Answers for Success
Master Class 10 Maths: Engaging Questions & Answers for Success
Master Class 10 Science: Engaging Questions & Answers for Success
Trending doubts
What is the median of the first 10 natural numbers class 10 maths CBSE
Which women's tennis player has 24 Grand Slam singles titles?
Who is the Brand Ambassador of Incredible India?
Why is there a time difference of about 5 hours between class 10 social science CBSE
Write a letter to the principal requesting him to grant class 10 english CBSE
A moving boat is observed from the top of a 150 m high class 10 maths CBSE