


How do you graph $ y = 6x $ ?
Answer
561k+ views
Hint:In this question we are supposed to draw the graph of a given equation $ y = 6x $ . The given equation is linear in order with respect to both variables $ x $ and $ y $ . To plot the graph of this equation we will first find some point i.e., pairs of $ x,y $ such that they satisfy the given equation. Then we will place these points on the X-Y plane.
Complete step by step solution:
In this question we need to plot the graph of equation $ y = 6x $ . To plot this equation we will first find that this equation is of line, circle or some other 2-D shapes. Since our given equation is of linear order in both the variables, so it can be the equation of a line. Because the equation of a straight line is of the form $ y = mx + c $ and our equation is $ y = 6x $ .
In our equation we have $ m = 6 $ and $ c = 0 $ . Since the given equation $ y = 6x $ is of a straight line.
Now, we will find some point which lies on the given equation by putting values of $ x $ and
$ y $ respectively.
$ y = 6x $ $ eq(1) $
Let us take $ x = 0 $ then value of $ x $ in $ eq(1) $ , we get $ y = 0 $ .
Similarly, Let us take $ x = 1 $ then value of $ x $ in $ eq(1) $ , we get $ y = 6 $ .
Similarly, Let us take $ x = 2 $ then value of $ x $ in $ eq(1) $ , we get $ y = 12 $ .
Similarly, Let us take $ x = - 1 $ then value of $ x $ in $ eq(1) $ , we get $ y = - 6 $ .Similarly, Let us take $ x = -
2 $ then value of $ x $ in $ eq(1) $ , we get $ y = - 12 $ .Now we have some points which lies on $ y = 6x $ , here is
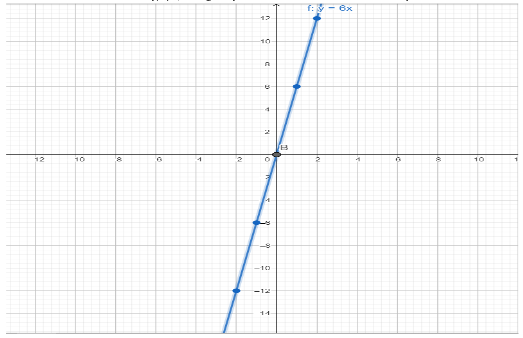
This blue dots are the above points which we find by assuming value of $ x $
Note: Questions in which you are asked to draw the graph of an equation you first need to figure out what kind of object this equation resembles. Then find some points which lie on the line. To check whether your graph is correct or not just take any point from the line put in the given equation, if it satisfies then your plotted graph is correct.
Complete step by step solution:
In this question we need to plot the graph of equation $ y = 6x $ . To plot this equation we will first find that this equation is of line, circle or some other 2-D shapes. Since our given equation is of linear order in both the variables, so it can be the equation of a line. Because the equation of a straight line is of the form $ y = mx + c $ and our equation is $ y = 6x $ .
In our equation we have $ m = 6 $ and $ c = 0 $ . Since the given equation $ y = 6x $ is of a straight line.
Now, we will find some point which lies on the given equation by putting values of $ x $ and
$ y $ respectively.
$ y = 6x $ $ eq(1) $
Let us take $ x = 0 $ then value of $ x $ in $ eq(1) $ , we get $ y = 0 $ .
Similarly, Let us take $ x = 1 $ then value of $ x $ in $ eq(1) $ , we get $ y = 6 $ .
Similarly, Let us take $ x = 2 $ then value of $ x $ in $ eq(1) $ , we get $ y = 12 $ .
Similarly, Let us take $ x = - 1 $ then value of $ x $ in $ eq(1) $ , we get $ y = - 6 $ .Similarly, Let us take $ x = -
2 $ then value of $ x $ in $ eq(1) $ , we get $ y = - 12 $ .Now we have some points which lies on $ y = 6x $ , here is
This blue dots are the above points which we find by assuming value of $ x $
Note: Questions in which you are asked to draw the graph of an equation you first need to figure out what kind of object this equation resembles. Then find some points which lie on the line. To check whether your graph is correct or not just take any point from the line put in the given equation, if it satisfies then your plotted graph is correct.
Recently Updated Pages
Master Class 11 Computer Science: Engaging Questions & Answers for Success
Master Class 11 Business Studies: Engaging Questions & Answers for Success
Master Class 11 Economics: Engaging Questions & Answers for Success
Master Class 11 English: Engaging Questions & Answers for Success
Master Class 11 Maths: Engaging Questions & Answers for Success
Master Class 11 Biology: Engaging Questions & Answers for Success
Trending doubts
One Metric ton is equal to kg A 10000 B 1000 C 100 class 11 physics CBSE
There are 720 permutations of the digits 1 2 3 4 5 class 11 maths CBSE
Discuss the various forms of bacteria class 11 biology CBSE
Draw a diagram of a plant cell and label at least eight class 11 biology CBSE
State the laws of reflection of light
Explain zero factorial class 11 maths CBSE