


How do you graph \[y = \tan x\]?
Answer
554.4k+ views
Hint:
To graph the function given, we need to locate the roots. We will use the fact that the function \[\tan x\] is not bounded, but approaches infinity at some points. So we will locate the infinite approaching points too, the vertical lines through which are called asymptotes. We will curve pass through the obtained roots, and make it approach the asymptotes to graph the given function.
Complete step by step solution:
We know that the period of the given function \[y = \tan x\] is equal to \[\pi \].
This means that the function \[y = \tan x\] repeats itself after an interval of \[\pi \].
So we can draw the graph of the given function in any interval of length \[\pi \] and copy it for the other intervals to obtain the final graph.
For this we need to choose the interval in which we make the graph. Before choosing it, let us try to locate the roots of \[y = \tan x\]. Therefore substituting \[y = 0\] in the given equation, we get
\[\tan x = 0\]
\[ \Rightarrow x = n\pi \]
So the roots are located at \[ - \pi ,0,\pi ,2\pi ......\]
Also, we try to locate the asymptotes. We know that the asymptotes for \[y = \tan x\] are given by\[x = \left( {2n + 1} \right)\dfrac{\pi }{2}\].
So let us choose our interval to be \[\left( { - \dfrac{\pi }{2},\dfrac{\pi }{2}} \right)\].
From the above information, we can draw the graph of \[y = \tan x\] in the interval \[\left( { - \dfrac{\pi }{2},\dfrac{\pi }{2}} \right)\] as
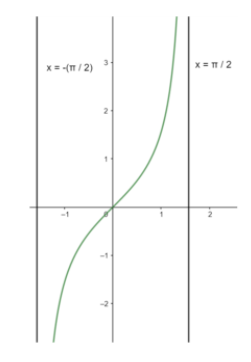
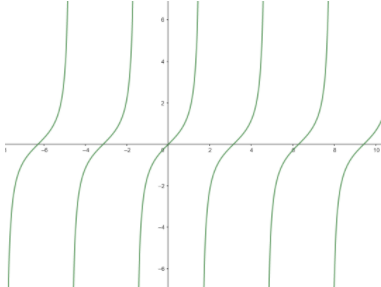
Since the function \[y = \tan x\] is periodic, so we copy the above graph for the other intervals to obtain the final graph of \[y = \tan x\] as
Note:
Here, we might make a mistake by drawing the graph by plotting the points. This is because then we have to ensure proper scaling, and then we will not be able to obtain a rough sketch. Also, for obtaining the proper shape, we can consider the derivative of the function \[y = \tan x\] at the roots. All trigonometric functions are periodic in nature, and hence the graph is repeated after a certain interval.
To graph the function given, we need to locate the roots. We will use the fact that the function \[\tan x\] is not bounded, but approaches infinity at some points. So we will locate the infinite approaching points too, the vertical lines through which are called asymptotes. We will curve pass through the obtained roots, and make it approach the asymptotes to graph the given function.
Complete step by step solution:
We know that the period of the given function \[y = \tan x\] is equal to \[\pi \].
This means that the function \[y = \tan x\] repeats itself after an interval of \[\pi \].
So we can draw the graph of the given function in any interval of length \[\pi \] and copy it for the other intervals to obtain the final graph.
For this we need to choose the interval in which we make the graph. Before choosing it, let us try to locate the roots of \[y = \tan x\]. Therefore substituting \[y = 0\] in the given equation, we get
\[\tan x = 0\]
\[ \Rightarrow x = n\pi \]
So the roots are located at \[ - \pi ,0,\pi ,2\pi ......\]
Also, we try to locate the asymptotes. We know that the asymptotes for \[y = \tan x\] are given by\[x = \left( {2n + 1} \right)\dfrac{\pi }{2}\].
So let us choose our interval to be \[\left( { - \dfrac{\pi }{2},\dfrac{\pi }{2}} \right)\].
From the above information, we can draw the graph of \[y = \tan x\] in the interval \[\left( { - \dfrac{\pi }{2},\dfrac{\pi }{2}} \right)\] as
Since the function \[y = \tan x\] is periodic, so we copy the above graph for the other intervals to obtain the final graph of \[y = \tan x\] as
Note:
Here, we might make a mistake by drawing the graph by plotting the points. This is because then we have to ensure proper scaling, and then we will not be able to obtain a rough sketch. Also, for obtaining the proper shape, we can consider the derivative of the function \[y = \tan x\] at the roots. All trigonometric functions are periodic in nature, and hence the graph is repeated after a certain interval.
Recently Updated Pages
Master Class 11 Computer Science: Engaging Questions & Answers for Success
Master Class 11 Business Studies: Engaging Questions & Answers for Success
Master Class 11 Economics: Engaging Questions & Answers for Success
Master Class 11 English: Engaging Questions & Answers for Success
Master Class 11 Maths: Engaging Questions & Answers for Success
Master Class 11 Biology: Engaging Questions & Answers for Success
Trending doubts
One Metric ton is equal to kg A 10000 B 1000 C 100 class 11 physics CBSE
There are 720 permutations of the digits 1 2 3 4 5 class 11 maths CBSE
Discuss the various forms of bacteria class 11 biology CBSE
Draw a diagram of a plant cell and label at least eight class 11 biology CBSE
State the laws of reflection of light
Explain zero factorial class 11 maths CBSE