


How do you graph $y=1-\cos x$ ?
Answer
558.9k+ views
Hint: In this question, we have to plot the graph of an equation. The equation given to us consists of trigonometric functions. So, we will first draw the graph of the parent function cosx, which is $y=\cos x$ and then we will draw the graph of $y=-\cos x$ as given in the question. After that, we see that both the parent function graph and $y=-\cos x$ , will have the same range. Then we will add 1 on the right-hand side of the equation and make the necessary changes in the new graph, that is we see that the new graph will shift upwards and lie above the x-axis, which is the required solution to the problem.
Complete answer:
According to the question, we have to plot a graph of a trigonometric equation.
The equation given to us is $y=1-\cos x$
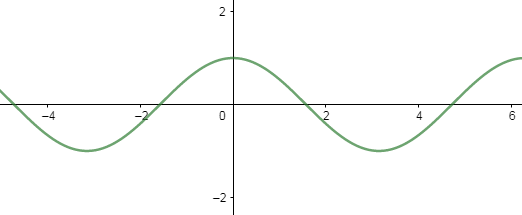
So, first, we will draw the graph of the parent function, that is
$\Rightarrow y=\cos x$ ----------- (1)
As we know the domain of cosx function is real numbers, and its range is $-1\le cosx\le 1$ , therefore the graph of the equation (1) is
Now, we will draw the graph of $y=-\cos x$ , because it is given in the question, we get
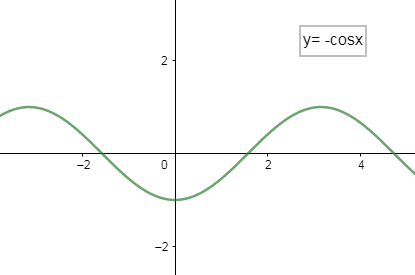
Thus, we see the graph of $y=-\cos x$ , reflect over the x-axis
Now, we will add 1 on the right-hand side of the equation (1), which means we are shifting our graph up by 1 unit, therefore, we get
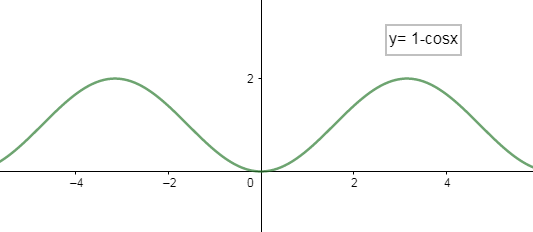
Therefore, we see in the above graph that as we add 1, the actual graph of $y=-\cos x$ shifts upward and lies above the x-axis.
The range of the new equation, that is $y=1-\cos x$ , is [0, 2].
Note: While drawing the graph in this question, do mention all the equations you are plotting. Keep in mind that 1 is adding in the equation $y=-\cos x$ and that is why the graph shifts upward and not below the x-axis.
Complete answer:
According to the question, we have to plot a graph of a trigonometric equation.
The equation given to us is $y=1-\cos x$
So, first, we will draw the graph of the parent function, that is
$\Rightarrow y=\cos x$ ----------- (1)
As we know the domain of cosx function is real numbers, and its range is $-1\le cosx\le 1$ , therefore the graph of the equation (1) is
Now, we will draw the graph of $y=-\cos x$ , because it is given in the question, we get
Thus, we see the graph of $y=-\cos x$ , reflect over the x-axis
Now, we will add 1 on the right-hand side of the equation (1), which means we are shifting our graph up by 1 unit, therefore, we get
Therefore, we see in the above graph that as we add 1, the actual graph of $y=-\cos x$ shifts upward and lies above the x-axis.
The range of the new equation, that is $y=1-\cos x$ , is [0, 2].
Note: While drawing the graph in this question, do mention all the equations you are plotting. Keep in mind that 1 is adding in the equation $y=-\cos x$ and that is why the graph shifts upward and not below the x-axis.
Recently Updated Pages
Master Class 11 Computer Science: Engaging Questions & Answers for Success
Master Class 11 Business Studies: Engaging Questions & Answers for Success
Master Class 11 Economics: Engaging Questions & Answers for Success
Master Class 11 English: Engaging Questions & Answers for Success
Master Class 11 Maths: Engaging Questions & Answers for Success
Master Class 11 Biology: Engaging Questions & Answers for Success
Trending doubts
One Metric ton is equal to kg A 10000 B 1000 C 100 class 11 physics CBSE
There are 720 permutations of the digits 1 2 3 4 5 class 11 maths CBSE
Discuss the various forms of bacteria class 11 biology CBSE
Draw a diagram of a plant cell and label at least eight class 11 biology CBSE
State the laws of reflection of light
Explain zero factorial class 11 maths CBSE