


How do you graph \[{y^2} = 9x\]?
Answer
540.9k+ views
Hint: To graph the given equation \[{y^2} = 9x\], as we can see that the given equation is a parabola with vertex at the origin i.e.,\[\left( {0,0} \right)\]. Hence, to graph the solution solve for y, and find the values of y with respect to x and then plot the graph and the obtained graph is a parabolic curve.
Complete step-by-step answer:
Let us write the given equation:
\[{y^2} = 9x\]
The given equation is a parabola with vertex at 0,0.
Let us solve the equation with respect to y as:
\[{y^2} = 9x\]
\[y = \pm \sqrt {9x} \]
As we have obtained the equation for y, now let us take 0 to 3 values for finding the values of x.
To graph the solution, solve one set of values for \[y = + \sqrt {9x} \] and another set of values for \[y = - \sqrt {9x} \] as we have obtained the equation of y as \[y = \pm \sqrt {9x} \].
When, \[y = + \sqrt {9x} \], the values of x and y are:
When, \[y = - \sqrt {9x} \], the values of x and y are:
Now, let us plot the graph using the obtained values.
Note: To work with parabolas in the coordinate plane, we consider, those with the vertex at the origin and those with the vertex at appoint other than the origin, and to graph the given equation we must note the points with respect to \[y = + \sqrt {9x} \] and \[y = - \sqrt {9x} \] as x values of both the expressions remains same, hence we need to solve for y.
Complete step-by-step answer:
Let us write the given equation:
\[{y^2} = 9x\]
The given equation is a parabola with vertex at 0,0.
Let us solve the equation with respect to y as:
\[{y^2} = 9x\]
\[y = \pm \sqrt {9x} \]
As we have obtained the equation for y, now let us take 0 to 3 values for finding the values of x.
To graph the solution, solve one set of values for \[y = + \sqrt {9x} \] and another set of values for \[y = - \sqrt {9x} \] as we have obtained the equation of y as \[y = \pm \sqrt {9x} \].
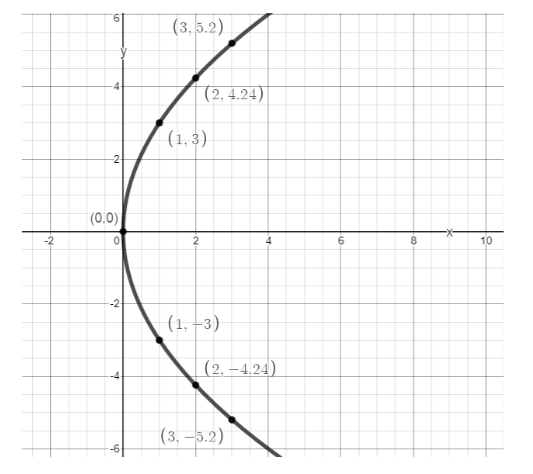
When, \[y = + \sqrt {9x} \], the values of x and y are:
| x | y |
| 0 | 0.0 |
| 1 | 3.0 |
| 2 | 4.24 |
| 3 | 5.20 |
When, \[y = - \sqrt {9x} \], the values of x and y are:
| x | y |
| 0 | 0.0 |
| 1 | -3.0 |
| 2 | -4.24 |
| 3 | -5.20 |
Now, let us plot the graph using the obtained values.
Note: To work with parabolas in the coordinate plane, we consider, those with the vertex at the origin and those with the vertex at appoint other than the origin, and to graph the given equation we must note the points with respect to \[y = + \sqrt {9x} \] and \[y = - \sqrt {9x} \] as x values of both the expressions remains same, hence we need to solve for y.

Recently Updated Pages
Master Class 8 Social Science: Engaging Questions & Answers for Success
Master Class 8 English: Engaging Questions & Answers for Success
Class 8 Question and Answer - Your Ultimate Solutions Guide
Master Class 8 Maths: Engaging Questions & Answers for Success
Master Class 8 Science: Engaging Questions & Answers for Success
Master Class 9 General Knowledge: Engaging Questions & Answers for Success
Trending doubts
Full form of STD, ISD and PCO
What are the 12 elements of nature class 8 chemistry CBSE
What is the difference between rai and mustard see class 8 biology CBSE
When people say No pun intended what does that mea class 8 english CBSE
Write a short biography of Dr APJ Abdul Kalam under class 8 english CBSE
Compare the manure and fertilizer in maintaining the class 8 biology CBSE