


How do you graph \[y=2x-9\]?
Answer
561.3k+ views
Hint: Suppose an equation of straight line to be \[y=ax+b\]. We can draw the graph of \[y=ax+b\] from the simple graph \[y=x\]. We need to modify the \[y=x\] graph by shifting and scaling methods. It is a better idea to modify the graph of \[y=x\] in such a manner that we get the required graph by going from left side to right side of the equation \[y=2x-9\].
As per the given question, we need to graph a straight line which is given by the equation \[y=2x-9\].
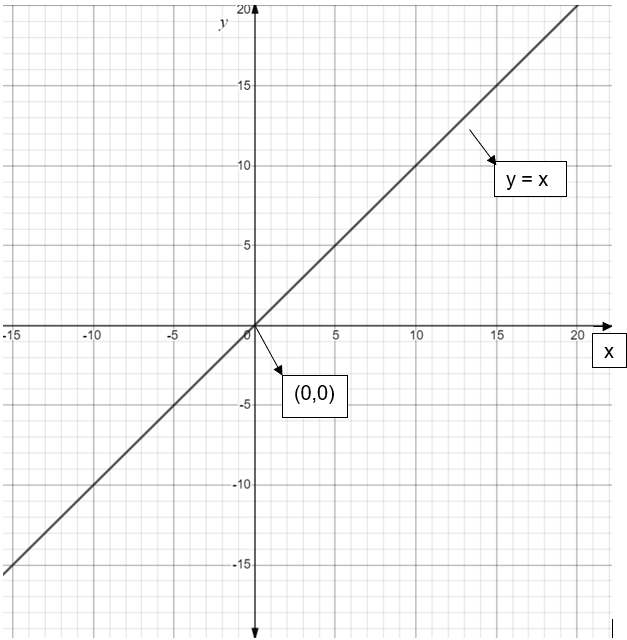
A straight line can be traced out on the cartesian plane by just two points lying on it. We can also use a third point for sort of check. It is very simple to graph the \[y=x\] line as it is symmetric to both x and y axes.
The graph of \[y=x\] is as shown in below figure:
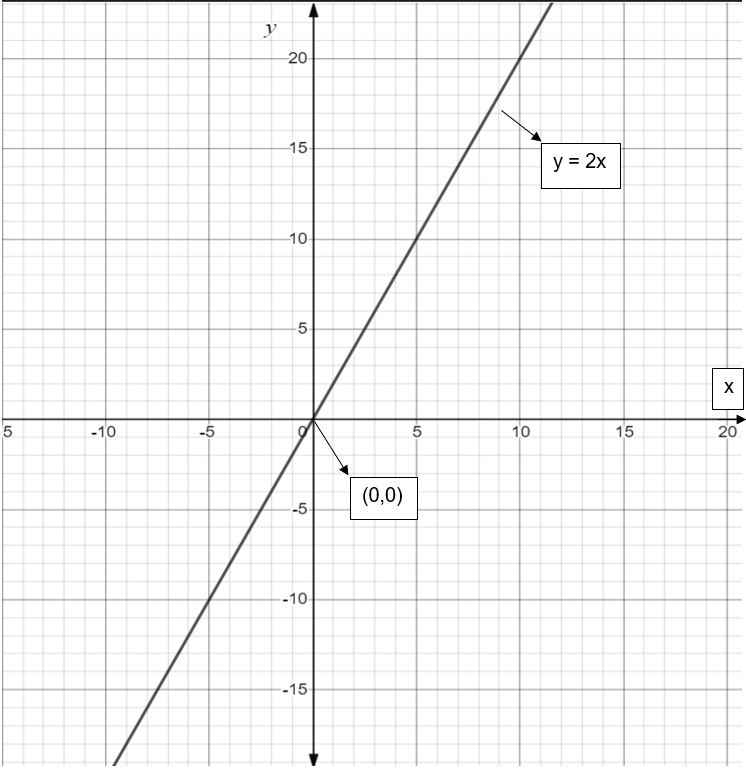
If we go from left hand side to right hand side of the equation \[y=2x-9\], it is clear that we need to first scale the \[y=x\] graph by a factor 2. Then we get, \[y=2x\].
And the graph of \[y=2x\] is as shown in the below figure:
Now, we need to shift the \[y=2x\] graph right hand side by \[\dfrac{9}{2}\] units to get the required straight line \[y=2x-9\]. And the graph of \[y=2x-9\] is shown in the below figure:
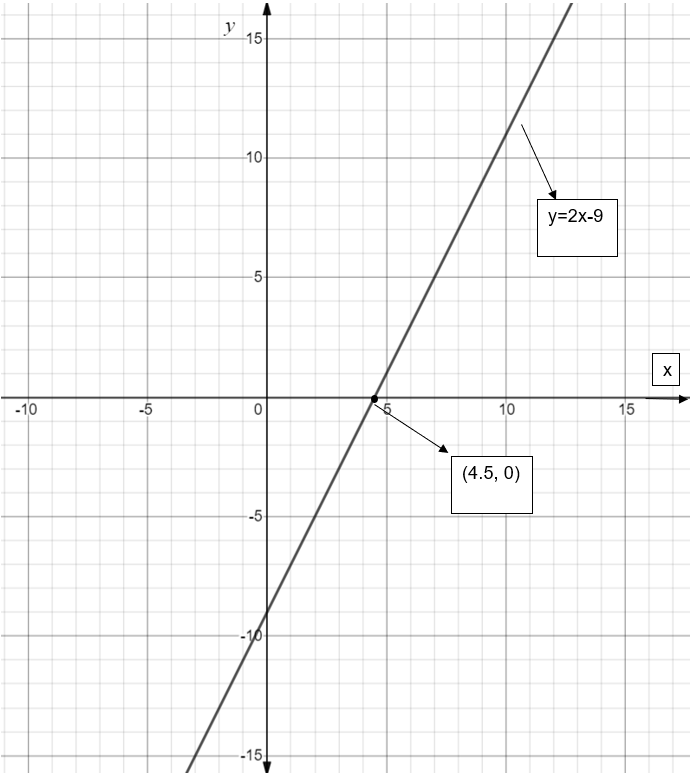
\[\therefore \] We have to compress \[y=x\] by 2 and then shift it to the right hand side by \[\dfrac{9}{2}\] units to get the desired line \[y=2x-9\].
Note:
We can trace the graph of \[y=2x-9\] by substitution by any two random values of x. We can also trace the graph by going from the right hand side to left hand side of the straight-line equation \[y=2x-9\]. So, by taking 2 common, we get \[y=2(x-\dfrac{9}{2})\]. That is, we have to shift the \[y=x\] graph by \[\dfrac{9}{2}\] units and then compress it by a factor 2 to get the graph of \[y=2x-9\].
As per the given question, we need to graph a straight line which is given by the equation \[y=2x-9\].
A straight line can be traced out on the cartesian plane by just two points lying on it. We can also use a third point for sort of check. It is very simple to graph the \[y=x\] line as it is symmetric to both x and y axes.
The graph of \[y=x\] is as shown in below figure:
If we go from left hand side to right hand side of the equation \[y=2x-9\], it is clear that we need to first scale the \[y=x\] graph by a factor 2. Then we get, \[y=2x\].
And the graph of \[y=2x\] is as shown in the below figure:
Now, we need to shift the \[y=2x\] graph right hand side by \[\dfrac{9}{2}\] units to get the required straight line \[y=2x-9\]. And the graph of \[y=2x-9\] is shown in the below figure:
\[\therefore \] We have to compress \[y=x\] by 2 and then shift it to the right hand side by \[\dfrac{9}{2}\] units to get the desired line \[y=2x-9\].
Note:
We can trace the graph of \[y=2x-9\] by substitution by any two random values of x. We can also trace the graph by going from the right hand side to left hand side of the straight-line equation \[y=2x-9\]. So, by taking 2 common, we get \[y=2(x-\dfrac{9}{2})\]. That is, we have to shift the \[y=x\] graph by \[\dfrac{9}{2}\] units and then compress it by a factor 2 to get the graph of \[y=2x-9\].
Recently Updated Pages
Master Class 11 Computer Science: Engaging Questions & Answers for Success
Master Class 11 Business Studies: Engaging Questions & Answers for Success
Master Class 11 Economics: Engaging Questions & Answers for Success
Master Class 11 English: Engaging Questions & Answers for Success
Master Class 11 Maths: Engaging Questions & Answers for Success
Master Class 11 Biology: Engaging Questions & Answers for Success
Trending doubts
One Metric ton is equal to kg A 10000 B 1000 C 100 class 11 physics CBSE
There are 720 permutations of the digits 1 2 3 4 5 class 11 maths CBSE
Discuss the various forms of bacteria class 11 biology CBSE
Draw a diagram of a plant cell and label at least eight class 11 biology CBSE
State the laws of reflection of light
Explain zero factorial class 11 maths CBSE