


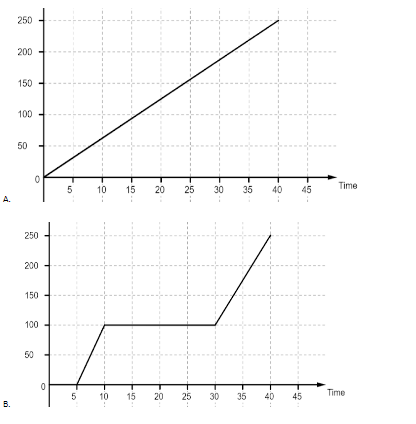
Ice is put in a closed container and heat is supplied to it continuously at uniform rate. Which of the following graphs give the temperature variation with time correctly?
Answer
583.5k+ views
Hint: We will look at all the four graphs and try to figure out what the differences in them mean and what they show. Then we will try to find the graph which matched the physical values and the physical phenomenon observed more closely.
Complete answer:
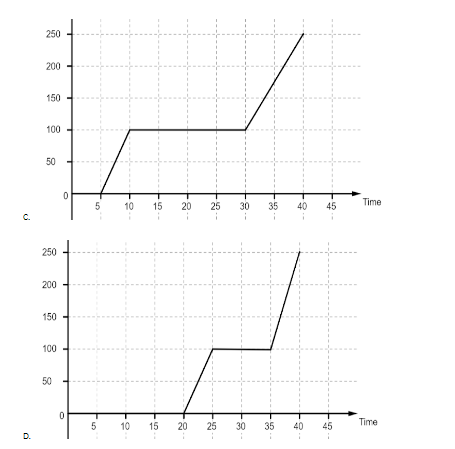
Let us have a look at the graphs first. The first graph is a linear graph between the temperature and time passed. It implies that all the heat is used up to increase the temperature of water and it increases at the same rate throughout. In the second graph we observe that the graph first remains at zero for some time and then the temperature starts to rise. The graph again becomes flat when it reaches the temperature of ${{100}^{o}}C$ and after that the temperature again starts rising, although at a different rate than before. The flat portions of the graph imply that the heat is being used for some other purpose than raising the temperature of water. Most likely that heat is being used to change the state of ice to water and then water to water vapor. The third graph is the same as the second graph, most likely a mistake. The general trend for the fourth graph is the same as the second one but the length of flat stretches are different. The first stretch is for the latent heat of fusion which is used to convert ice into water and the second stretch is for the latent heat of vaporization which is used to convert water into water vapor. Since the latent heat of vaporization is more, it will take more time for water to convert into vapor than to turn into water from ice.
So, the correct answer is “Option B or C”.
Note:
Take care that in haste you do not pick the first option without looking at the temperature given on the y-axis. That will be the graph followed if only we considered heating water from ${{0}^{o}}C$ to ${{100}^{o}}C$. But as the change also takes place, there will be latent heats which must be considered.
Complete answer:
Let us have a look at the graphs first. The first graph is a linear graph between the temperature and time passed. It implies that all the heat is used up to increase the temperature of water and it increases at the same rate throughout. In the second graph we observe that the graph first remains at zero for some time and then the temperature starts to rise. The graph again becomes flat when it reaches the temperature of ${{100}^{o}}C$ and after that the temperature again starts rising, although at a different rate than before. The flat portions of the graph imply that the heat is being used for some other purpose than raising the temperature of water. Most likely that heat is being used to change the state of ice to water and then water to water vapor. The third graph is the same as the second graph, most likely a mistake. The general trend for the fourth graph is the same as the second one but the length of flat stretches are different. The first stretch is for the latent heat of fusion which is used to convert ice into water and the second stretch is for the latent heat of vaporization which is used to convert water into water vapor. Since the latent heat of vaporization is more, it will take more time for water to convert into vapor than to turn into water from ice.
So, the correct answer is “Option B or C”.
Note:
Take care that in haste you do not pick the first option without looking at the temperature given on the y-axis. That will be the graph followed if only we considered heating water from ${{0}^{o}}C$ to ${{100}^{o}}C$. But as the change also takes place, there will be latent heats which must be considered.
Recently Updated Pages
Master Class 11 Computer Science: Engaging Questions & Answers for Success
Master Class 11 Business Studies: Engaging Questions & Answers for Success
Master Class 11 Economics: Engaging Questions & Answers for Success
Master Class 11 English: Engaging Questions & Answers for Success
Master Class 11 Maths: Engaging Questions & Answers for Success
Master Class 11 Biology: Engaging Questions & Answers for Success
Trending doubts
One Metric ton is equal to kg A 10000 B 1000 C 100 class 11 physics CBSE
There are 720 permutations of the digits 1 2 3 4 5 class 11 maths CBSE
Discuss the various forms of bacteria class 11 biology CBSE
Draw a diagram of a plant cell and label at least eight class 11 biology CBSE
State the laws of reflection of light
10 examples of friction in our daily life