


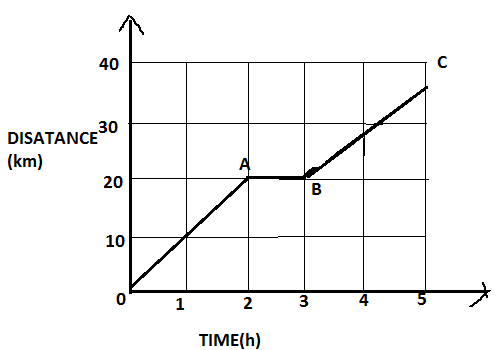
In the adjoining figure is shown the time- distance \[\left( {t - s} \right)\] graph of a cyclist. Find out from the graph:
(i) Maximum speed of the cyclist.
(ii) Average speed in the whole journey.

Answer
579.6k+ views
Hint: We know that motion is a change in the position of an object with time. In order to specify the position, we need to use a reference point and a set of axes. Graphical analysis is a convenient method of studying the motion of particles. It can be effectively applied to analyze the motion of a particle.
Complete step by step answer:
Consider a given graph; mark its distance as $OA$, $AB$ and $BC$ respectively,
In general, speed is a ratio of distance by time taken.
That is, ${\text{speed = }}\dfrac{{{\text{distance}}}}{{{\text{time}}}}$
A cyclist travels a distance of \[20km\] that is $OA$ in $2$ hours then, speed is given by,
$s = \dfrac{d}{t}$
$ \Rightarrow s= \dfrac{{20}}{2}$
$\Rightarrow s= 10km{h^{ - 1}}$
And from $A$ to $B$, there is no distance travelled by the cyclist. Means, a cyclist is at rest for one hour.
Thus, speed is zero.
Next, form b to c cyclists travels a distance of $15km$ in $2$ hours. This is less than $20km$. Therefore,
Speed is given by,
$s = \dfrac{d}{t}$
$ \Rightarrow s=\dfrac{{15}}{2}$
$\Rightarrow s= 7.5km{h^{ - 1}}$
Thus, from these we can say, the maximum speed of the cyclist is $10km{h^{ - 1}}$. That is from $0$ to $a$.
Average speed is the ratio of total distance to the total time taken.
$ \Rightarrow {\text{average speed = }}\dfrac{{{\text{average distance}}}}{{{\text{total time}}}}$
Total distance travelled by the cyclist is $20 + 0 + 15 = 35km$
And total time taken=$5$ hours
Then, ${\text{average speed = }}\dfrac{{35}}{5} = 7km{h^{ - 1}}$
$\therefore$ The maximum speed of the cyclist is $10km{h^{ - 1}}$ and the average speed in the whole journey is $7km{h^{ - 1}}$.
Additional information:
For graphical representation, we require two coordinate axes. For usual representation we will consider the x-axis and y-axis. Distance-time graph is represented by plotting distance along the y-axis and time is along the x-axis. A straight line parallel to X-axis in the distance-time graph tells us an object is at rest.
Note:
The slope of distance-time gives the velocity of the particle.
Displacement of a particle is the shortest distance between the initial and final position of the body.
Distance is the total path length covered by the body.
Recently Updated Pages
Master Class 11 Computer Science: Engaging Questions & Answers for Success
Master Class 11 Business Studies: Engaging Questions & Answers for Success
Master Class 11 Economics: Engaging Questions & Answers for Success
Master Class 11 English: Engaging Questions & Answers for Success
Master Class 11 Maths: Engaging Questions & Answers for Success
Master Class 11 Biology: Engaging Questions & Answers for Success
Trending doubts
One Metric ton is equal to kg A 10000 B 1000 C 100 class 11 physics CBSE
There are 720 permutations of the digits 1 2 3 4 5 class 11 maths CBSE
Discuss the various forms of bacteria class 11 biology CBSE
Draw a diagram of a plant cell and label at least eight class 11 biology CBSE
State the laws of reflection of light
Explain zero factorial class 11 maths CBSE