


Look at the bar graph given. What information does the bar graph give?
Answer
521.1k+ views
Hint: We are given a bar graph where the objects are subjects and the marks obtained are their quantities. From the given bar graph, we need to find out the marks of each subject and the highest and the lowest marks scored overall.
Complete step by step answer:
In mathematics, and more specifically in graph theory, a graph is a structure amounting to a set of objects in which some pairs of the objects are in some sense "related". The objects correspond to mathematical abstractions called vertices (also called nodes or points) and each of the related pairs of vertices is called an edge (also called link or line). Typically, a graph is depicted in diagrammatic form as a set of dots or circles for the vertices, joined by lines or curves for the edges. Graphs are one of the objects of study in discrete mathematics.
A bar chart or bar graph is a chart or graph that presents categorical data with rectangular bars with heights or lengths proportional to the values that they represent. The x-axis of the bar graph gives the object and the y-axis represents the quantity of the objects. Each bar corresponds to an object and its height denotes its quantity.
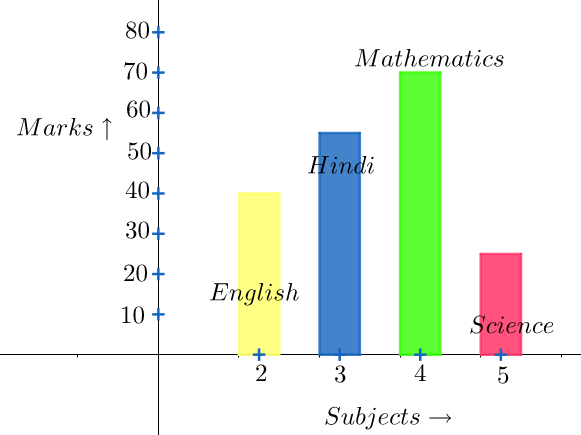
The information that we get is:
A. The marks scored in the subject mathematics is $70$ and is the highest.
B. The marks scored in the subject science is $25$ and is the lowest.
C. The marks scored in the subject Hindi is $55$ and is the second highest.
D. The marks scored in the subject English is $40$ and is the second lowest.
Note: The one thing that we must be very careful in bar graph studies is the measurement of the height of each bar. Sometimes, the bar seems to be at par with the mark quantity but it isn’t. Also, sometimes the x-axis of the bar graph indicates the range of the quantities.
Complete step by step answer:
In mathematics, and more specifically in graph theory, a graph is a structure amounting to a set of objects in which some pairs of the objects are in some sense "related". The objects correspond to mathematical abstractions called vertices (also called nodes or points) and each of the related pairs of vertices is called an edge (also called link or line). Typically, a graph is depicted in diagrammatic form as a set of dots or circles for the vertices, joined by lines or curves for the edges. Graphs are one of the objects of study in discrete mathematics.
A bar chart or bar graph is a chart or graph that presents categorical data with rectangular bars with heights or lengths proportional to the values that they represent. The x-axis of the bar graph gives the object and the y-axis represents the quantity of the objects. Each bar corresponds to an object and its height denotes its quantity.
The information that we get is:
A. The marks scored in the subject mathematics is $70$ and is the highest.
B. The marks scored in the subject science is $25$ and is the lowest.
C. The marks scored in the subject Hindi is $55$ and is the second highest.
D. The marks scored in the subject English is $40$ and is the second lowest.
Note: The one thing that we must be very careful in bar graph studies is the measurement of the height of each bar. Sometimes, the bar seems to be at par with the mark quantity but it isn’t. Also, sometimes the x-axis of the bar graph indicates the range of the quantities.
Recently Updated Pages
Master Class 8 Social Science: Engaging Questions & Answers for Success
Master Class 8 English: Engaging Questions & Answers for Success
Class 8 Question and Answer - Your Ultimate Solutions Guide
Master Class 8 Maths: Engaging Questions & Answers for Success
Master Class 8 Science: Engaging Questions & Answers for Success
Master Class 9 General Knowledge: Engaging Questions & Answers for Success
Trending doubts
What is BLO What is the full form of BLO class 8 social science CBSE
Citizens of India can vote at the age of A 18 years class 8 social science CBSE
Full form of STD, ISD and PCO
Advantages and disadvantages of science
Right to vote is a AFundamental Right BFundamental class 8 social science CBSE
What are the 12 elements of nature class 8 chemistry CBSE