


Lothar Meyer obtained the curve for the known elements by plotting their atomic volumes against:
A. atomic numbers
B. atomic masses
C. densities
D. ionization energies
Answer
583.2k+ views
Hint:An atomic volume of elements is the volume that will be occupied by one mole of that particular element. It is normally expressed in cubic cm and is equal to the volume occupied by one gram atomic weight of an element.
Complete step by step answer:
Before the early discovery of the periodic table given by Mendeleev the periodic properties of the elements were studied against their atomic weights. The physical properties include atomic volume, melting points and boiling points which are studied with the first 28 elements discovered.
In this aspect, Lothar Meyer who was a German chemist studied the variations of atomic volumes with respect to atomic masses or atomic weights. He plotted the results obtained in the form of a graph. The atomic volumes are plotted along the y-axis and the atomic masses are plotted along the x-axis.
The graph obtained by plotting atomic volume vs. atomic mass is as follows:
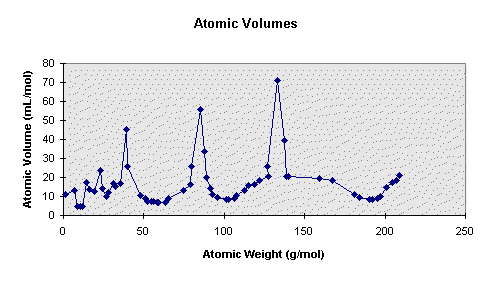
The curve represents a series of maxima and minima. The graph consists of several peaks which are occupied by electropositive elements. The alkali metals occur at the peaks of the curve. The halogens are positioned at the rising of the curves. Noble gases are present just before the alkali metals.
Thus the work of Lothar Meyers has a significant contribution for determining the position of elements to be placed in the periodic table.
Hence the correct option is B i.e. atomic masses.
Note: Initially the old periodic table was proposed following the atomic masses of elements. Later on the concept of atomic number, densities and ionization energies are studied in detail which led to the modern periodic table.
Complete step by step answer:
Before the early discovery of the periodic table given by Mendeleev the periodic properties of the elements were studied against their atomic weights. The physical properties include atomic volume, melting points and boiling points which are studied with the first 28 elements discovered.
In this aspect, Lothar Meyer who was a German chemist studied the variations of atomic volumes with respect to atomic masses or atomic weights. He plotted the results obtained in the form of a graph. The atomic volumes are plotted along the y-axis and the atomic masses are plotted along the x-axis.
The graph obtained by plotting atomic volume vs. atomic mass is as follows:
The curve represents a series of maxima and minima. The graph consists of several peaks which are occupied by electropositive elements. The alkali metals occur at the peaks of the curve. The halogens are positioned at the rising of the curves. Noble gases are present just before the alkali metals.
Thus the work of Lothar Meyers has a significant contribution for determining the position of elements to be placed in the periodic table.
Hence the correct option is B i.e. atomic masses.
Note: Initially the old periodic table was proposed following the atomic masses of elements. Later on the concept of atomic number, densities and ionization energies are studied in detail which led to the modern periodic table.
Recently Updated Pages
Master Class 11 Computer Science: Engaging Questions & Answers for Success
Master Class 11 Business Studies: Engaging Questions & Answers for Success
Master Class 11 Economics: Engaging Questions & Answers for Success
Master Class 11 English: Engaging Questions & Answers for Success
Master Class 11 Maths: Engaging Questions & Answers for Success
Master Class 11 Biology: Engaging Questions & Answers for Success
Trending doubts
One Metric ton is equal to kg A 10000 B 1000 C 100 class 11 physics CBSE
There are 720 permutations of the digits 1 2 3 4 5 class 11 maths CBSE
Discuss the various forms of bacteria class 11 biology CBSE
Draw a diagram of a plant cell and label at least eight class 11 biology CBSE
State the laws of reflection of light
Explain zero factorial class 11 maths CBSE