


How do I make a phase diagram diagram for water?
Answer
548.4k+ views
Hint: Phase diagram is a graphical representation used for showing the physical states of a substance under different conditions of temperature and pressure. In a typical phase diagram pressure is present on the y-axis and the temperature is present on the x-axis.
Complete step by step answer:
Water is present in different forms, the water present in the solid form (ice) is less denser than the water present in the liquid form. As the liquid is changing to solid, the process here is the freezing. The freezing curve on the phase diagram represents the transition between liquid and solid states.
The phase diagram of the water is shown below.
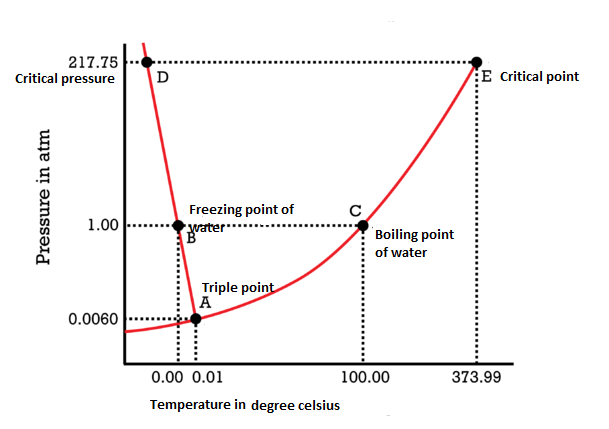
The above diagram is edited using paint.
Triple point represents the point on a phase diagram at which the three states of matter: gas, liquid, and solid coexist
Critical point represents the point on a phase diagram at which the substance is indistinguishable between liquid and gaseous states.
In the phase diagram of water the slope between the solid and liquid states is negative rather than positive because water in solid state is less dense than the liquid state. This is why ice floats in liquid. Due to this, a pressure change has the opposite effect on those two phases. When the ice is relatively near its melting point, it can be changed into liquid water by applying pressure. The water molecules are actually closer together in the liquid phase than they are in the solid phase.
The point E, is the critical point which means that at $373.99^\circ C$, particles of water in the gas phase are moving rapidly. At any temperature higher than that, the gas can be liquefied, no matter how much pressure is applied to the gas. The critical pressure is the pressure that must be applied to the gas at the critical temperature in order to change in liquid. For water, the critical pressure is very high, 217.75 atm. The critical point is the intersection point of the critical temperature and the critical pressure.
Note: Water has an exception as in the normal phase diagram the solid – liquid phase line slope is positive to the right, example in carbon dioxide but in case of water the slope between the solid and liquid states is negative.
Complete step by step answer:
Water is present in different forms, the water present in the solid form (ice) is less denser than the water present in the liquid form. As the liquid is changing to solid, the process here is the freezing. The freezing curve on the phase diagram represents the transition between liquid and solid states.
The phase diagram of the water is shown below.
The above diagram is edited using paint.
Triple point represents the point on a phase diagram at which the three states of matter: gas, liquid, and solid coexist
Critical point represents the point on a phase diagram at which the substance is indistinguishable between liquid and gaseous states.
In the phase diagram of water the slope between the solid and liquid states is negative rather than positive because water in solid state is less dense than the liquid state. This is why ice floats in liquid. Due to this, a pressure change has the opposite effect on those two phases. When the ice is relatively near its melting point, it can be changed into liquid water by applying pressure. The water molecules are actually closer together in the liquid phase than they are in the solid phase.
The point E, is the critical point which means that at $373.99^\circ C$, particles of water in the gas phase are moving rapidly. At any temperature higher than that, the gas can be liquefied, no matter how much pressure is applied to the gas. The critical pressure is the pressure that must be applied to the gas at the critical temperature in order to change in liquid. For water, the critical pressure is very high, 217.75 atm. The critical point is the intersection point of the critical temperature and the critical pressure.
Note: Water has an exception as in the normal phase diagram the solid – liquid phase line slope is positive to the right, example in carbon dioxide but in case of water the slope between the solid and liquid states is negative.
Recently Updated Pages
Master Class 11 Computer Science: Engaging Questions & Answers for Success
Master Class 11 Business Studies: Engaging Questions & Answers for Success
Master Class 11 Economics: Engaging Questions & Answers for Success
Master Class 11 English: Engaging Questions & Answers for Success
Master Class 11 Maths: Engaging Questions & Answers for Success
Master Class 11 Biology: Engaging Questions & Answers for Success
Trending doubts
One Metric ton is equal to kg A 10000 B 1000 C 100 class 11 physics CBSE
There are 720 permutations of the digits 1 2 3 4 5 class 11 maths CBSE
Discuss the various forms of bacteria class 11 biology CBSE
Draw a diagram of a plant cell and label at least eight class 11 biology CBSE
State the laws of reflection of light
Explain zero factorial class 11 maths CBSE