


On acceleration time graph, a horizontal line indicates:
Answer
515.4k+ views
Hint:The same way as velocity vs time graphs tell us about an object's displacement, acceleration vs time graphs inform us about its velocity. The area under the graph for a specific time interval is equal to the change in velocity during the same time interval.
Complete step by step answer:
The acceleration vs. time graph will show a straight horizontal line at \[y = 0.\] Because acceleration is the derivative of velocity, the slope of the curves on a velocity vs. time graph can be used to predict what an acceleration vs. time graph for an object's motion would look like (much as the slopes of the curves on a position vs. time graph can be used to predict what a \[v\] vs \[t\] graph will look like, because velocity is the first derivative of position).
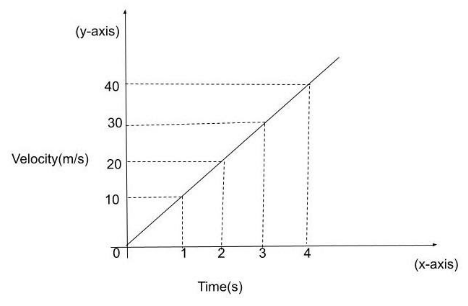
The independent variable on a graph of velocity vs time is time, which is depicted on the x-axis. On the y-axis, velocity is plotted, and the graph depicts how velocity varies over time.A horizontal line on the graph depicts a velocity that is constant through time (e.g., no acceleration). It would apply to an object moving at a constant speed in a vacuum with no external forces acting on it.
If the \[v\] vs $t$ graph's lines are straight and horizontal, indicating that the item is moving at a constant velocity, the slopes of those lines are $0$ , and the $a$ vs \[t\] graph should show a straight, horizontal line at \[y = 0\] (along the z-axis).
Note: If your acceleration is positive at one point, your velocity will increase at that point. If you have a negative acceleration, your velocity will decrease. Finally, if your acceleration is zero, your velocity will remain constant and will not change.
Complete step by step answer:
The acceleration vs. time graph will show a straight horizontal line at \[y = 0.\] Because acceleration is the derivative of velocity, the slope of the curves on a velocity vs. time graph can be used to predict what an acceleration vs. time graph for an object's motion would look like (much as the slopes of the curves on a position vs. time graph can be used to predict what a \[v\] vs \[t\] graph will look like, because velocity is the first derivative of position).
The independent variable on a graph of velocity vs time is time, which is depicted on the x-axis. On the y-axis, velocity is plotted, and the graph depicts how velocity varies over time.A horizontal line on the graph depicts a velocity that is constant through time (e.g., no acceleration). It would apply to an object moving at a constant speed in a vacuum with no external forces acting on it.
If the \[v\] vs $t$ graph's lines are straight and horizontal, indicating that the item is moving at a constant velocity, the slopes of those lines are $0$ , and the $a$ vs \[t\] graph should show a straight, horizontal line at \[y = 0\] (along the z-axis).
Note: If your acceleration is positive at one point, your velocity will increase at that point. If you have a negative acceleration, your velocity will decrease. Finally, if your acceleration is zero, your velocity will remain constant and will not change.
Recently Updated Pages
Master Class 11 Computer Science: Engaging Questions & Answers for Success
Master Class 11 Business Studies: Engaging Questions & Answers for Success
Master Class 11 Economics: Engaging Questions & Answers for Success
Master Class 11 English: Engaging Questions & Answers for Success
Master Class 11 Maths: Engaging Questions & Answers for Success
Master Class 11 Biology: Engaging Questions & Answers for Success
Trending doubts
There are 720 permutations of the digits 1 2 3 4 5 class 11 maths CBSE
Discuss the various forms of bacteria class 11 biology CBSE
Explain zero factorial class 11 maths CBSE
What organs are located on the left side of your body class 11 biology CBSE
Draw a diagram of nephron and explain its structur class 11 biology CBSE
How do I convert ms to kmh Give an example class 11 physics CBSE