


On which item is the expenditure maximum?
A. Food
B. Education
C. Rent
D. Savings
Answer
468.9k+ views
Hint: First we have to define what the terms we need to solve the problem are
Expenditure of each item is given in the question. Compare the expenditure in Food, education, rent, and savings. Each sector of a pie chart represents each item in the given data. The total is equal to \[{360^0}\].The total value of the pie is always \[100\% \].
Complete answer:
It is given that the expenditure for food, education, rent, savings.
To find the maximum expenditure, we compare the expenditure of items
We know the expenditure of all items.
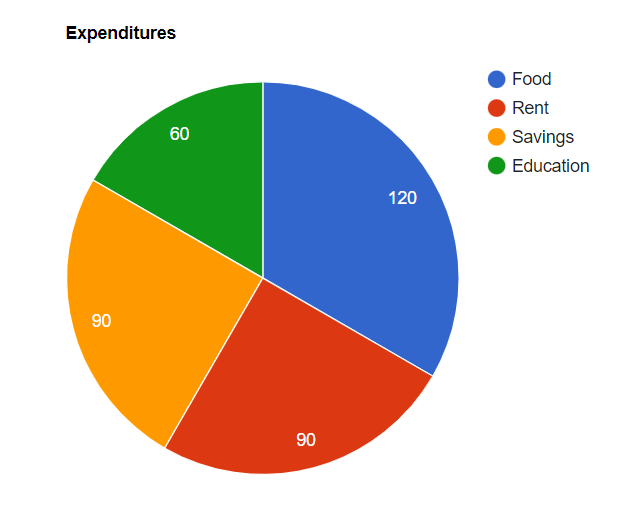
Expenditure for food \[ = {120^0}\]
Expenditure for Rent \[ = {90^0}\]
Expenditure for education\[ = {60^0}\]
Savings \[ = {90^0}\]
Total value of all items is \[120 + 90 + 90 + 60 = 360\]
The total value of the pie chart is always equal to \[{360^0}\].
By comparing the expenditure of all items,
\[{120^0} > {90^0} > {60^0}\]
\[{120^0}\] is the highest value among all items
Expenditure for food \[ > \] Expenditure for rent or Savings \[ > \] Expenditure for education
By comparing the other expenditures, expenditure for food is greater than all.
This shows that expenditure for food is Maximum.
Hence, the correct option is (A), Food.
Note:
Pie chart can be used to show percentage, and represents percentage at a set points.
A whole circle contains \[{360^0}\].In a pie chart, these \[{360^0}\] corresponds to the total values represented on the chart. In the given problem.
The pie chart is comprehensively used because it is easy to read and access data. It is also used to understand and depicting the data in category.
Expenditure of each item is given in the question. Compare the expenditure in Food, education, rent, and savings. Each sector of a pie chart represents each item in the given data. The total is equal to \[{360^0}\].The total value of the pie is always \[100\% \].
Complete answer:
It is given that the expenditure for food, education, rent, savings.
To find the maximum expenditure, we compare the expenditure of items
We know the expenditure of all items.
Expenditure for food \[ = {120^0}\]
Expenditure for Rent \[ = {90^0}\]
Expenditure for education\[ = {60^0}\]
Savings \[ = {90^0}\]
Total value of all items is \[120 + 90 + 90 + 60 = 360\]
The total value of the pie chart is always equal to \[{360^0}\].
By comparing the expenditure of all items,
\[{120^0} > {90^0} > {60^0}\]
\[{120^0}\] is the highest value among all items
Expenditure for food \[ > \] Expenditure for rent or Savings \[ > \] Expenditure for education
By comparing the other expenditures, expenditure for food is greater than all.
This shows that expenditure for food is Maximum.
Hence, the correct option is (A), Food.
Note:
Pie chart can be used to show percentage, and represents percentage at a set points.
A whole circle contains \[{360^0}\].In a pie chart, these \[{360^0}\] corresponds to the total values represented on the chart. In the given problem.
The pie chart is comprehensively used because it is easy to read and access data. It is also used to understand and depicting the data in category.
Recently Updated Pages
Master Class 10 Computer Science: Engaging Questions & Answers for Success
Master Class 10 General Knowledge: Engaging Questions & Answers for Success
Master Class 10 English: Engaging Questions & Answers for Success
Master Class 10 Social Science: Engaging Questions & Answers for Success
Master Class 10 Maths: Engaging Questions & Answers for Success
Master Class 10 Science: Engaging Questions & Answers for Success
Trending doubts
What is the median of the first 10 natural numbers class 10 maths CBSE
Which women's tennis player has 24 Grand Slam singles titles?
Who is the Brand Ambassador of Incredible India?
Why is there a time difference of about 5 hours between class 10 social science CBSE
Write a letter to the principal requesting him to grant class 10 english CBSE
A moving boat is observed from the top of a 150 m high class 10 maths CBSE