
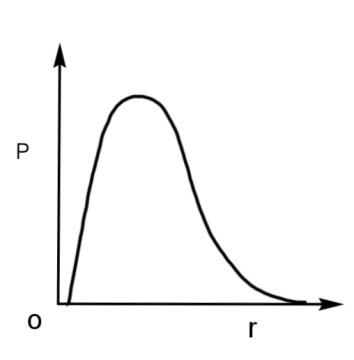
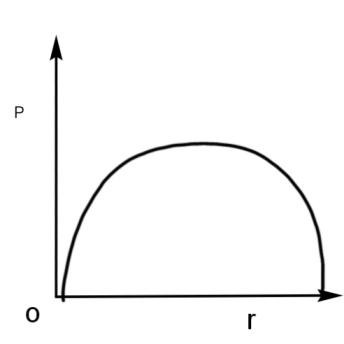
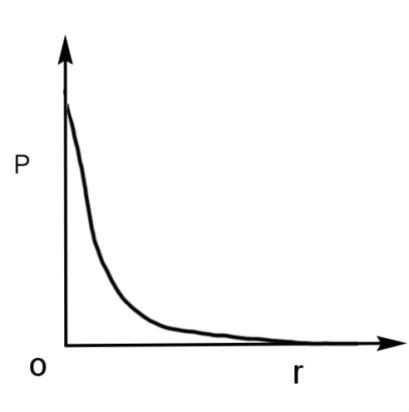
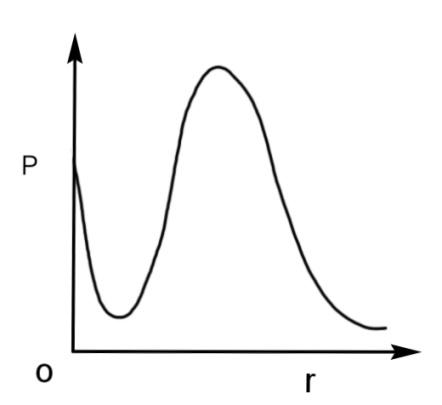
P is the probability of finding the 1s electron of hydrogen atom in a spherical shell of infinitesimal thickness, dr, at a distance r from the nucleus. The volume of this shell is$4\pi {{r}^{3}}dr$. The qualitative sketch of the dependence of P on r is:
A.
B.
C.
D.


Answer
524.4k+ views
Hint: There are various orbitals in which an electron is placed like s, p, d, f. A hydrogen atom consists of only s orbital. The 1 and 2 are the energy levels that increase as the electrons start filling into the shells. The higher orbits are away from the nucleus. So, the 1 s orbital will be near the nucleus. The radius of an atom is half the distance from the nucleus of an atom.
Complete answer:
We have been given a hydrogen atom in a spherical shell of infinitesimal thickness, ‘dr’, at a distance r from the nucleus. The volume of this shell is$4\pi {{r}^{3}}dr$. We have to find the graph plotted against P, probability of finding the 1s electron of this atom and ‘r’ the radius of the atom.
The waves in the given graphs depicts the probability density, meaning the orbital where the probability of finding an electron is maximum. For 1 s orbital, the probability of finding an electron will be maximum at the nucleus, as 1 s orbital is the nearest to the nucleus as it is the lowest orbital in terms of energy.
Therefore, the radial probability curve which shows a peak at the nucleus will have the maximum probability with respect to the radius. The curve is
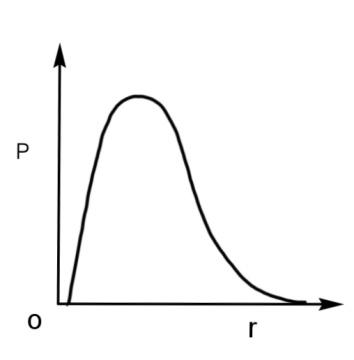
Hence, the qualitative sketch of the dependence of P on r is the radial probability curve, so option A is correct.
Note:
The P of 1 s orbital is maximum at the nucleus and it decreases sharply as we move away from it. For the 2 s orbital, it decreases until it reaches zero, then increases again till it reaches a maximum peak, and then again decreases and becomes zero as the value of the radius increases.
Complete answer:
We have been given a hydrogen atom in a spherical shell of infinitesimal thickness, ‘dr’, at a distance r from the nucleus. The volume of this shell is$4\pi {{r}^{3}}dr$. We have to find the graph plotted against P, probability of finding the 1s electron of this atom and ‘r’ the radius of the atom.
The waves in the given graphs depicts the probability density, meaning the orbital where the probability of finding an electron is maximum. For 1 s orbital, the probability of finding an electron will be maximum at the nucleus, as 1 s orbital is the nearest to the nucleus as it is the lowest orbital in terms of energy.
Therefore, the radial probability curve which shows a peak at the nucleus will have the maximum probability with respect to the radius. The curve is

Hence, the qualitative sketch of the dependence of P on r is the radial probability curve, so option A is correct.
Note:
The P of 1 s orbital is maximum at the nucleus and it decreases sharply as we move away from it. For the 2 s orbital, it decreases until it reaches zero, then increases again till it reaches a maximum peak, and then again decreases and becomes zero as the value of the radius increases.
Recently Updated Pages
Master Class 11 Computer Science: Engaging Questions & Answers for Success

Master Class 11 Business Studies: Engaging Questions & Answers for Success

Master Class 11 Economics: Engaging Questions & Answers for Success

Master Class 11 English: Engaging Questions & Answers for Success

Master Class 11 Maths: Engaging Questions & Answers for Success

Master Class 11 Biology: Engaging Questions & Answers for Success

Trending doubts
One Metric ton is equal to kg A 10000 B 1000 C 100 class 11 physics CBSE

There are 720 permutations of the digits 1 2 3 4 5 class 11 maths CBSE

Discuss the various forms of bacteria class 11 biology CBSE

Draw a diagram of a plant cell and label at least eight class 11 biology CBSE

State the laws of reflection of light

Explain zero factorial class 11 maths CBSE


