


Pictorial representation of data is called:
A. Bar graph
B. Histogram
C. Pictograph
D. None of these
Answer
565.5k+ views
Hint: We use the definition of each type of graphs given in the options. Check from the definitions which graph has pictures as its part.
Complete step-by-step solution:
We first define types of graphs given in the options and using the definitions we say which graph gives us pictorial representation.
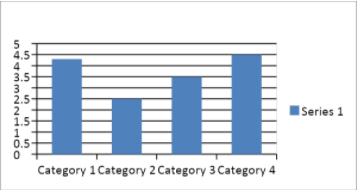
A. Bar graph:
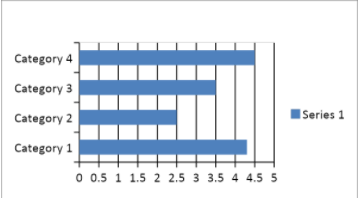
A bar graph is a graph that gives the graphical representation of data in form of bars or strips which indicate the category of data. It has two types- Vertical bar graph and Horizontal bar graph.
Vertical bar graph is represented as below:
Horizontal bar graph is represented as below:
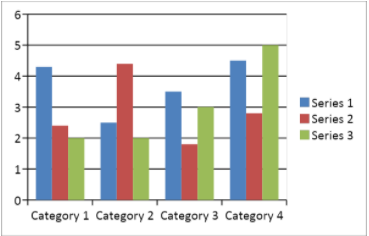
B. Histogram:
A histogram is a graphical representation that organizes a group of data points into ranges formed by the user. It is very similar to a bar graph but unlike a bar graph it doesn’t have space in between bars.
A histogram is usually represented as follows:
C. Pictograph:
A pictograph is a way of representing given data in the form of pictures linked to that data. So it is basically a ‘pictorial’ representation of the data. The pictures which are to be used for representing the data depend on the data.
Example: If we have to represent data of quantity of milk using milk bottles and the scale is given as below then we use a picture of milk bottles to represent the data.
Scale:
100 litre =

50 litre =

From the three given definitions we see the definition which gives pictorial representation of data is of a Pictograph.
\[\therefore \]Option C is correct.
Note: Students are likely to make the mistake of choosing histogram as the correct option as they have no idea about definition of graphs as students mostly have heard of bar graphs. We write definitions and a rough representation for better understanding of types of graph and then derive the answer from that.
Complete step-by-step solution:
We first define types of graphs given in the options and using the definitions we say which graph gives us pictorial representation.
A. Bar graph:
A bar graph is a graph that gives the graphical representation of data in form of bars or strips which indicate the category of data. It has two types- Vertical bar graph and Horizontal bar graph.
Vertical bar graph is represented as below:
Horizontal bar graph is represented as below:
B. Histogram:
A histogram is a graphical representation that organizes a group of data points into ranges formed by the user. It is very similar to a bar graph but unlike a bar graph it doesn’t have space in between bars.
A histogram is usually represented as follows:
C. Pictograph:
A pictograph is a way of representing given data in the form of pictures linked to that data. So it is basically a ‘pictorial’ representation of the data. The pictures which are to be used for representing the data depend on the data.
Example: If we have to represent data of quantity of milk using milk bottles and the scale is given as below then we use a picture of milk bottles to represent the data.
| DAYS | SALES |
| SUNDAY | 


|
| MONDAY | 


|
| TUESDAY | 


|
| WEDNESDAY | 


|
| THURSDAY | 


|
| FRIDAY | 


|
| SATURDAY | 


|
Scale:
100 litre =
50 litre =
From the three given definitions we see the definition which gives pictorial representation of data is of a Pictograph.
\[\therefore \]Option C is correct.
Note: Students are likely to make the mistake of choosing histogram as the correct option as they have no idea about definition of graphs as students mostly have heard of bar graphs. We write definitions and a rough representation for better understanding of types of graph and then derive the answer from that.
Recently Updated Pages
Master Class 11 Computer Science: Engaging Questions & Answers for Success
Master Class 11 Business Studies: Engaging Questions & Answers for Success
Master Class 11 Economics: Engaging Questions & Answers for Success
Master Class 11 English: Engaging Questions & Answers for Success
Master Class 11 Maths: Engaging Questions & Answers for Success
Master Class 11 Biology: Engaging Questions & Answers for Success
Trending doubts
One Metric ton is equal to kg A 10000 B 1000 C 100 class 11 physics CBSE
There are 720 permutations of the digits 1 2 3 4 5 class 11 maths CBSE
Discuss the various forms of bacteria class 11 biology CBSE
Draw a diagram of a plant cell and label at least eight class 11 biology CBSE
State the laws of reflection of light
Explain zero factorial class 11 maths CBSE