


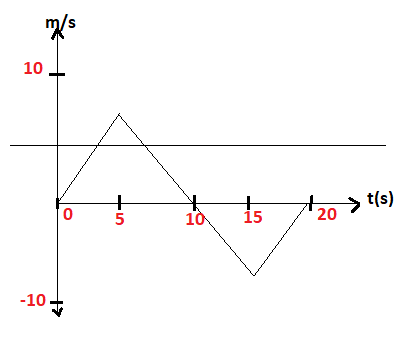
Plot acceleration time graph of figure shown
A.

B.
C.
D.
Answer
604.8k+ views
Hint: In this question, we need to start with finding the slope of each time range in the graph which gives us the knowledge acceleration that is when the velocity is increasing the acceleration is +ve / Velocity is decreasing then the acceleration is -ve which we can be seen in time range t that is $a = \dfrac{{dv}}{{dt}}$.
Complete Step-by-Step solution:
We all know that acceleration is the rate of change of velocity with respect to time.
Let us assume velocity be \[v\] and time be $t$ now, we get that differentiation of velocity with respect to time gives us the acceleration $a$ of the body.
$a = \dfrac{{dv}}{{dt}}$
And it can be seen from the graph that the slope of the velocity vs time graph is nothing but acceleration
$slope = \dfrac{{dv}}{{dt}} = a$
Now we will see one by one the nature of the slope of each part in the graph
Acceleration in the range t=0 to t=5 is
$ \Rightarrow a = \dfrac{{dv}}{{dt}} = \dfrac{{10 - 0}}{{5 - 0}} = 2m/{s^2}$
Acceleration in the range t=5 to t=10 is
$ \Rightarrow a = \dfrac{{dv}}{{dt}} = \dfrac{{0 - 10}}{{10 - 5}} = - 2m/{s^2}$
Acceleration in the range t=10 to t=15 is
$ \Rightarrow a = \dfrac{{dv}}{{dt}} = \dfrac{{0 - \left( { - 10} \right)}}{{10 - 15}} = - 2m/{s^2}$
Acceleration in the range t=15 to t=20 is
$ \Rightarrow a = \dfrac{{dv}}{{dt}} = \dfrac{{\left( { - 10} \right) - 0}}{{15 - 20}} = 2m/{s^2}$
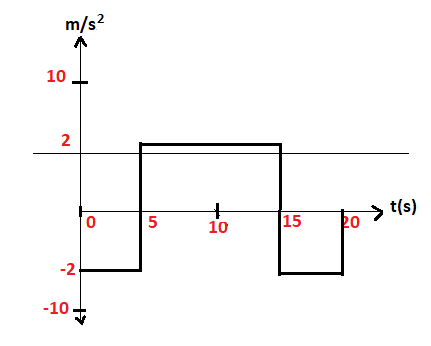
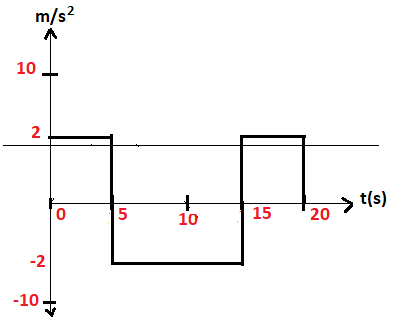
Now, we can see that the graph we are getting is as shown in figure 1.
Hence option A is correct.
Note: For these types of questions initially we need to know the basics of the graphs that are the slope of displacement vs time gives velocity, area of acceleration time graph also gives velocity, area of velocity vs time graph gives displacement, etc. Then we need to know how the variation in velocity affects the acceleration and how to plot the graph.
Complete Step-by-Step solution:
We all know that acceleration is the rate of change of velocity with respect to time.
Let us assume velocity be \[v\] and time be $t$ now, we get that differentiation of velocity with respect to time gives us the acceleration $a$ of the body.
$a = \dfrac{{dv}}{{dt}}$
And it can be seen from the graph that the slope of the velocity vs time graph is nothing but acceleration
$slope = \dfrac{{dv}}{{dt}} = a$
Now we will see one by one the nature of the slope of each part in the graph
Acceleration in the range t=0 to t=5 is
$ \Rightarrow a = \dfrac{{dv}}{{dt}} = \dfrac{{10 - 0}}{{5 - 0}} = 2m/{s^2}$
Acceleration in the range t=5 to t=10 is
$ \Rightarrow a = \dfrac{{dv}}{{dt}} = \dfrac{{0 - 10}}{{10 - 5}} = - 2m/{s^2}$
Acceleration in the range t=10 to t=15 is
$ \Rightarrow a = \dfrac{{dv}}{{dt}} = \dfrac{{0 - \left( { - 10} \right)}}{{10 - 15}} = - 2m/{s^2}$
Acceleration in the range t=15 to t=20 is
$ \Rightarrow a = \dfrac{{dv}}{{dt}} = \dfrac{{\left( { - 10} \right) - 0}}{{15 - 20}} = 2m/{s^2}$
Now, we can see that the graph we are getting is as shown in figure 1.
Figure 1.
Hence option A is correct.
Note: For these types of questions initially we need to know the basics of the graphs that are the slope of displacement vs time gives velocity, area of acceleration time graph also gives velocity, area of velocity vs time graph gives displacement, etc. Then we need to know how the variation in velocity affects the acceleration and how to plot the graph.
Recently Updated Pages
Master Class 10 Computer Science: Engaging Questions & Answers for Success
Master Class 10 General Knowledge: Engaging Questions & Answers for Success
Master Class 10 English: Engaging Questions & Answers for Success
Master Class 10 Social Science: Engaging Questions & Answers for Success
Master Class 10 Maths: Engaging Questions & Answers for Success
Master Class 10 Science: Engaging Questions & Answers for Success
Trending doubts
What is the median of the first 10 natural numbers class 10 maths CBSE
Which women's tennis player has 24 Grand Slam singles titles?
Who is the Brand Ambassador of Incredible India?
Why is there a time difference of about 5 hours between class 10 social science CBSE
Write a letter to the principal requesting him to grant class 10 english CBSE
A moving boat is observed from the top of a 150 m high class 10 maths CBSE