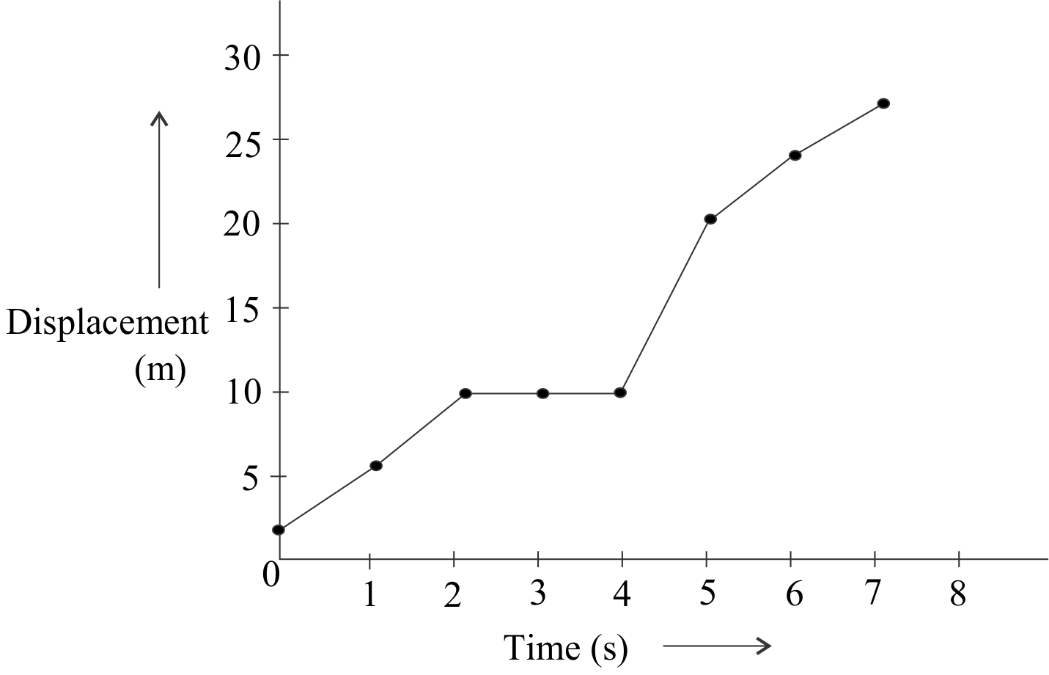
Plot the displacement-time graph and calculate the total displacement in the interval 1s to 5s.If a body is moving in a straight line and its displacement at various instants of time is given in the following table:
Time(s) 0 1 2 3 4 5 6 7 Displacement(m) 2 6 12 12 12 18 22 24
A) 18 m
B) 16 m
C) 12 m
D) 10 m
| Time(s) | 0 | 1 | 2 | 3 | 4 | 5 | 6 | 7 |
| Displacement(m) | 2 | 6 | 12 | 12 | 12 | 18 | 22 | 24 |
Answer
568.5k+ views
Hint:Displacement is the shortest distance from the initial to the final position of the body – magnitude wise. Direction of displacement is considered from the initial position to the final position.
The S.I unit of displacement is metre(m)
Step By Step Solution:
Graph will be:

(b) So, the total displacement in the interval 1s to 5s is:
(c) Hence the correct answer is 12m.
Note:Distance is the length of the pathway moved by any body or object at a particular time, scalar quantity, dependent on the path followed by the object, since it has magnitude only, the value is always positive and can be more than or equal to the magnitude of displacement. While displacement is the distance covered by an object in a particular direction at a certain time, vector quantity, independent of the path followed by the object, since it has both magnitude and direction, it value can be positive or negative and can be less than or equal to the distance, but never greater than the distance .
The S.I unit of displacement is metre(m)
Step By Step Solution:
Graph will be:

- (a) From the graph, it is clear that at time 1s the initial displacement is 6m and at 5s final displacement is 18m.
Final Displacement- initial Displacement
18 m – 6 m = 12m
Note:Distance is the length of the pathway moved by any body or object at a particular time, scalar quantity, dependent on the path followed by the object, since it has magnitude only, the value is always positive and can be more than or equal to the magnitude of displacement. While displacement is the distance covered by an object in a particular direction at a certain time, vector quantity, independent of the path followed by the object, since it has both magnitude and direction, it value can be positive or negative and can be less than or equal to the distance, but never greater than the distance .
Recently Updated Pages
Master Class 11 Computer Science: Engaging Questions & Answers for Success

Master Class 11 Business Studies: Engaging Questions & Answers for Success

Master Class 11 Economics: Engaging Questions & Answers for Success

Master Class 11 English: Engaging Questions & Answers for Success

Master Class 11 Maths: Engaging Questions & Answers for Success

Master Class 11 Biology: Engaging Questions & Answers for Success

Trending doubts
One Metric ton is equal to kg A 10000 B 1000 C 100 class 11 physics CBSE

There are 720 permutations of the digits 1 2 3 4 5 class 11 maths CBSE

Discuss the various forms of bacteria class 11 biology CBSE

Draw a diagram of a plant cell and label at least eight class 11 biology CBSE

State the laws of reflection of light

Explain zero factorial class 11 maths CBSE


