


Plot the graph of line \[x{\text{ }} = {\text{ }}5\].
Answer
570.9k+ views
Hint:
When we are to plot the graph $ x = k $ then the straight line parallel to the y-axis would be there passing through the point $ x = k $ . The line would be vertical as the line $ y = 0 $ that is y-axis is also vertical on the graph.
Complete step by step solution:
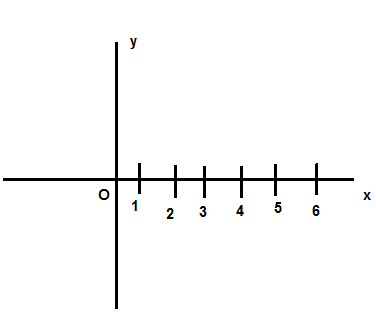
Step 1 Draw a horizontal line first and name its x-axis.
Step 2. then draw a vertical line intersecting the x-axis in the middle and name its y-axis.
Step 3. Name the point of intersection as O. where O represents the origin.
Step 4. Draw the markings from 1 to 5 on the x-axis which will occur on the right-hand side of the origin and make sure the markings would be equidistant to each other.
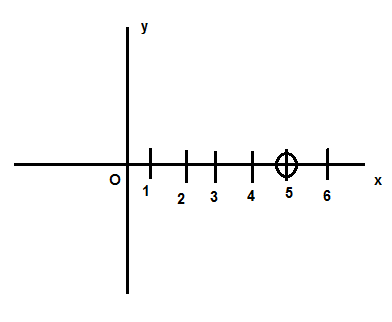
Step 5 . Encircle the point $ x = 5 $
Step 6. Draw a straight line parallel to y axis passing through the point $ x = 5 $ that you encircled.
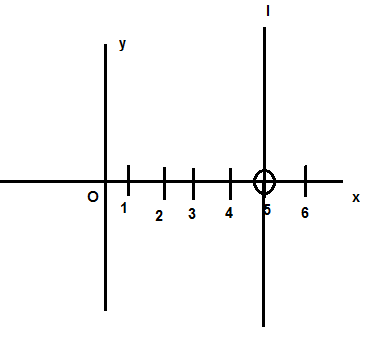
Step 7. Name the line l which is the required graph of $ x = 5 $
Note:
1) We know that the graph basically consists of two axes ; x-axis and y-axis.
2) x-axis is the horizontal one whereas the y –axis is the vertical one.
3) If we plot the graph $ x = k $ , the line would be parallel to the y axis passing through $ x = k $ i.e. the vertical line would be there.
4) If we have to plot the graph of $ y = p $ , the line would be parallel to the x axis passing through the point $ x = k $ a horizontal line would be there.
5) If we have to plot the graph of line $ x = y $ then a straight line passing through the origin would be there. This line is neither horizontal nor vertical.
When we are to plot the graph $ x = k $ then the straight line parallel to the y-axis would be there passing through the point $ x = k $ . The line would be vertical as the line $ y = 0 $ that is y-axis is also vertical on the graph.
Complete step by step solution:
Step 1 Draw a horizontal line first and name its x-axis.
Step 2. then draw a vertical line intersecting the x-axis in the middle and name its y-axis.
Step 3. Name the point of intersection as O. where O represents the origin.
Step 4. Draw the markings from 1 to 5 on the x-axis which will occur on the right-hand side of the origin and make sure the markings would be equidistant to each other.
Step 5 . Encircle the point $ x = 5 $
Step 6. Draw a straight line parallel to y axis passing through the point $ x = 5 $ that you encircled.
Step 7. Name the line l which is the required graph of $ x = 5 $
Note:
1) We know that the graph basically consists of two axes ; x-axis and y-axis.
2) x-axis is the horizontal one whereas the y –axis is the vertical one.
3) If we plot the graph $ x = k $ , the line would be parallel to the y axis passing through $ x = k $ i.e. the vertical line would be there.
4) If we have to plot the graph of $ y = p $ , the line would be parallel to the x axis passing through the point $ x = k $ a horizontal line would be there.
5) If we have to plot the graph of line $ x = y $ then a straight line passing through the origin would be there. This line is neither horizontal nor vertical.
Recently Updated Pages
Master Class 11 Computer Science: Engaging Questions & Answers for Success
Master Class 11 Business Studies: Engaging Questions & Answers for Success
Master Class 11 Economics: Engaging Questions & Answers for Success
Master Class 11 English: Engaging Questions & Answers for Success
Master Class 11 Maths: Engaging Questions & Answers for Success
Master Class 11 Biology: Engaging Questions & Answers for Success
Trending doubts
One Metric ton is equal to kg A 10000 B 1000 C 100 class 11 physics CBSE
There are 720 permutations of the digits 1 2 3 4 5 class 11 maths CBSE
Discuss the various forms of bacteria class 11 biology CBSE
Draw a diagram of a plant cell and label at least eight class 11 biology CBSE
State the laws of reflection of light
Explain zero factorial class 11 maths CBSE