


Plot the points \[(1,1)\] \[(2, - 2)\] and \[( - 1, - 2)\] on a graph paper and find the area of the figure so obtained.
Answer
569.4k+ views
Hint: First draw the x and y axis. Observe the points, see in which quadrant each of them will lie and plot them accordingly. To find the area of the figure, join the points and observe which shape they form and recall the formula for the area of that particular shape, use it to find the area of the figure obtained.
Complete step-by-step answer:
Given, the points \[(1,1)\] \[(2, - 2)\] and \[( - 1, - 2)\]
Let the points be \[P(1,1),\,Q(2, - 2)\] and \[R( - 1, - 2)\] .
To plot these points, first we need to draw x-axis and y-axis.
We observe that there are four quadrants, now we plot the points P, Q and R accordingly.
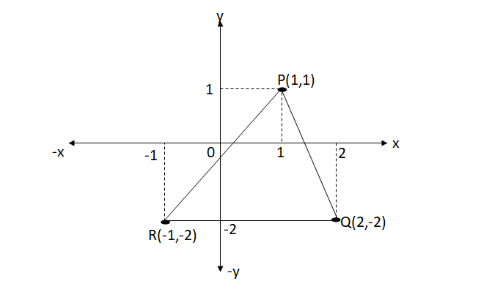
We observe that the figure obtained by joining the points is a triangle
Area of a triangle is given by
\[\Rightarrow A = \dfrac{1}{2} \times {\text{base}} \times {\text{height}}\] (i)
Here, if we take RQ as the base the height of the triangle will be equal to the perpendicular distance between the point P and line RQ, and from the figure we observe the height is,
\[\Rightarrow H = 1 + 2 = 3\]
The base is equal to the length of the line RQ, which can observe from the figure we can observe from the figure as
\[\Rightarrow B = 1 + 2 = 3\]
Now, area of the triangle PQR is,
\[\Rightarrow A = \dfrac{1}{2} \times B \times H\]
Putting the values of B and H, we get
\[\Rightarrow A = \dfrac{1}{2} \times 3 \times 3 \\
\Rightarrow A = \dfrac{9}{2}{\text{sq}}\,{\text{units}} \]
Therefore, the area of the figure is \[\dfrac{9}{2}{\text{sq}}\,{\text{units}}\] .
So, the correct answer is “ \[\dfrac{9}{2}{\text{sq}}\,{\text{units}}\] ”.
Note: While plotting points on the graph, always check on which quadrant the points may fall. There are four quadrants as we have observed in this question. Observe carefully the x and y component of the point that is whether they are positive or negative and accordingly plot them on the graph.
Complete step-by-step answer:
Given, the points \[(1,1)\] \[(2, - 2)\] and \[( - 1, - 2)\]
Let the points be \[P(1,1),\,Q(2, - 2)\] and \[R( - 1, - 2)\] .
To plot these points, first we need to draw x-axis and y-axis.
We observe that there are four quadrants, now we plot the points P, Q and R accordingly.
We observe that the figure obtained by joining the points is a triangle
Area of a triangle is given by
\[\Rightarrow A = \dfrac{1}{2} \times {\text{base}} \times {\text{height}}\] (i)
Here, if we take RQ as the base the height of the triangle will be equal to the perpendicular distance between the point P and line RQ, and from the figure we observe the height is,
\[\Rightarrow H = 1 + 2 = 3\]
The base is equal to the length of the line RQ, which can observe from the figure we can observe from the figure as
\[\Rightarrow B = 1 + 2 = 3\]
Now, area of the triangle PQR is,
\[\Rightarrow A = \dfrac{1}{2} \times B \times H\]
Putting the values of B and H, we get
\[\Rightarrow A = \dfrac{1}{2} \times 3 \times 3 \\
\Rightarrow A = \dfrac{9}{2}{\text{sq}}\,{\text{units}} \]
Therefore, the area of the figure is \[\dfrac{9}{2}{\text{sq}}\,{\text{units}}\] .
So, the correct answer is “ \[\dfrac{9}{2}{\text{sq}}\,{\text{units}}\] ”.
Note: While plotting points on the graph, always check on which quadrant the points may fall. There are four quadrants as we have observed in this question. Observe carefully the x and y component of the point that is whether they are positive or negative and accordingly plot them on the graph.
Recently Updated Pages
Master Class 11 Computer Science: Engaging Questions & Answers for Success
Master Class 11 Business Studies: Engaging Questions & Answers for Success
Master Class 11 Economics: Engaging Questions & Answers for Success
Master Class 11 English: Engaging Questions & Answers for Success
Master Class 11 Maths: Engaging Questions & Answers for Success
Master Class 11 Biology: Engaging Questions & Answers for Success
Trending doubts
One Metric ton is equal to kg A 10000 B 1000 C 100 class 11 physics CBSE
There are 720 permutations of the digits 1 2 3 4 5 class 11 maths CBSE
Discuss the various forms of bacteria class 11 biology CBSE
Draw a diagram of a plant cell and label at least eight class 11 biology CBSE
State the laws of reflection of light
Explain zero factorial class 11 maths CBSE