


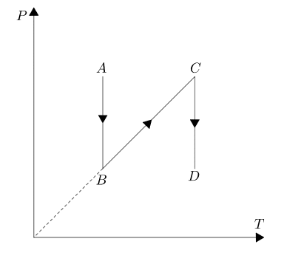
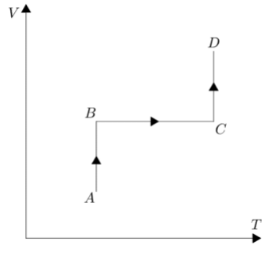
$P-T$ diagram is shown in figure. Choose the $V-T$ diagram?
A.
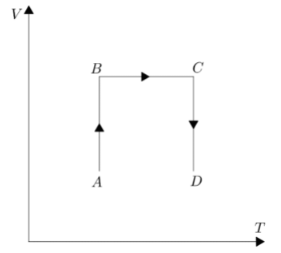
B.
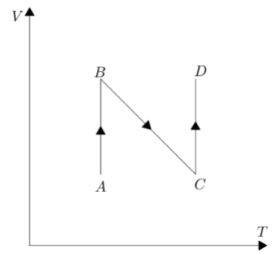
C.
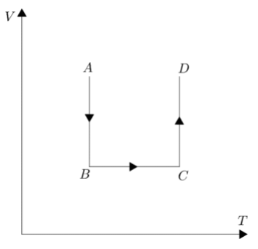
D.
Answer
516.9k+ views
Hint:We will be using ideal gas equation \[PV=nRT\](consider \[nR\] as constant) for solving this equation. Break the graph in parts to analyse pressure and temperature in that part so as to get an idea of how volume would change in accordance with the ideal gas equation.
Complete step by step answer:
Let us break the graph into individual processes to get a better understanding of the change in the factors. In part AB of the P-T graph, pressure is decreasing but temperature is constant. Now according to the ideal gas equation \[PV=nRT\], if we move the volume to the right hand side in order to get a relation in pressure and temperature.
We get \[P=(nR/V)T\], let’s consider the term inside brackets as \[K\]. Now seeing the trend in AB part of the graph temperature is constant hence according to the relation we have pressure should also be constant but its not. Hence this means pressure is dependent on \[K\] and if pressure is decreasing then \[K\] should also decrease, if \[K\] is decreasing then volume should increase since \[K\] and volume are inversely proportional to each other.
Coming to the BC part of the graph, temperature and pressure both are increasing simultaneously, hence we can say that this time volume should be constant in order to maintain the graph. If we alter the value of volume in this part then pressure will either increase at a sharper rate as compared to temperature or it will decrease. We can say volume is constant in this BC part.
Coming to the CD part of the graph, again temperature is constant and pressure is decreasing which is similar to the first part, hence we can say volume will increase in this case.Analyzing all the cases we can say option D is the best suited alternative V-T graph for the given P-T graph.
Hence, the correct answer is option D.
Note:To solve such type of question you should have great understanding of straight lines, circle, parabola, ellipse and hyperbola because in some question you may encounter graphs that are parabolic, elliptical or hyperbolic in nature there you should be able to relate it with gas laws.
Recently Updated Pages
Master Class 11 Computer Science: Engaging Questions & Answers for Success
Master Class 11 Business Studies: Engaging Questions & Answers for Success
Master Class 11 Economics: Engaging Questions & Answers for Success
Master Class 11 English: Engaging Questions & Answers for Success
Master Class 11 Maths: Engaging Questions & Answers for Success
Master Class 11 Biology: Engaging Questions & Answers for Success
Trending doubts
One Metric ton is equal to kg A 10000 B 1000 C 100 class 11 physics CBSE
There are 720 permutations of the digits 1 2 3 4 5 class 11 maths CBSE
Discuss the various forms of bacteria class 11 biology CBSE
Draw a diagram of a plant cell and label at least eight class 11 biology CBSE
State the laws of reflection of light
10 examples of friction in our daily life