


What is the range of temperature in Bangalore over \[11\] years?
A.\[{20^ \circ }C\]
B.\[{10^ \circ }C\]
C.\[{33^ \circ }C\]
D.\[{45^ \circ }C\]
Answer
580.2k+ views
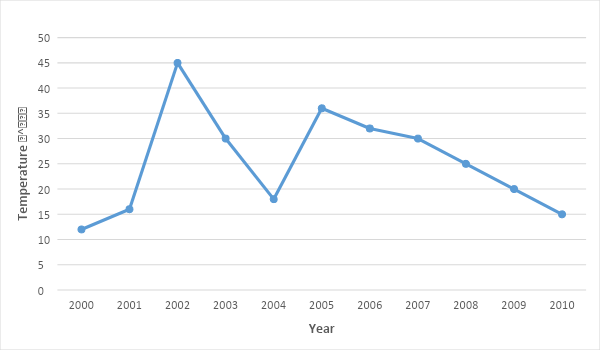
Hint: The definition of range says that it is the difference between the two most extreme values between which the distribution lies. So by observing the graph we can find out the lowest and the highest temperature in Bangalore over the \[11\] years. Then find the difference between them to get the range.
Complete step-by-step answer:
From the graph it is observed that the maximum temperature in Bangalore in \[11\] years was \[{45^ \circ }C\], and the minimum temperature attained was around \[{12^ \circ }C\].
Let the lowest temperature be denoted by \[l\] and the highest temperature be denoted by \[h\], then the range (\[R\]) will be given as \[R = h - l\].
From the given data, as we know that \[h = {45^ \circ }C\] and \[l = {12^ \circ }C\], we can substitute these values in the above formula to get \[R = 45 - 12 = 33\].
Thus, the range of temperature in Bangalore in \[11\] years will be \[{33^ \circ }C\].
Hence, option (C) will be the correct option.
Note: The range of a given distribution will have units as per the distribution given. In this case the unit will be degree Celsius. Range of the data can help us to give information about the accuracy of some of the data such as mean, median, etc. of the distribution. A smaller range indicates much more precision in these values as the variation will be as minimal as possible. However a large range offers many more values that the distribution may attain but these may not be always true, as range depends only on the extreme values and not the in-between values.
Recently Updated Pages
Master Class 10 Computer Science: Engaging Questions & Answers for Success
Master Class 10 General Knowledge: Engaging Questions & Answers for Success
Master Class 10 English: Engaging Questions & Answers for Success
Master Class 10 Social Science: Engaging Questions & Answers for Success
Master Class 10 Maths: Engaging Questions & Answers for Success
Master Class 10 Science: Engaging Questions & Answers for Success
Trending doubts
What is the median of the first 10 natural numbers class 10 maths CBSE
Which women's tennis player has 24 Grand Slam singles titles?
Who is the Brand Ambassador of Incredible India?
Why is there a time difference of about 5 hours between class 10 social science CBSE
Write a letter to the principal requesting him to grant class 10 english CBSE
A moving boat is observed from the top of a 150 m high class 10 maths CBSE