Read the passage and answer the following question.
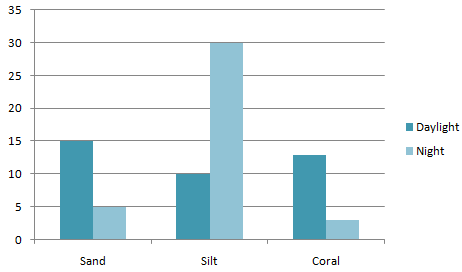
SAND SILT CORAL Daylight 15 10 13 Night 5 30 3
A student wanted to know where a particular type of fish was most likely to be found during a 24 hour period. He observed a total of 76 fish over several days. The student wanted to present the data to his fishing club. Which of the following statements explains correctly the given data?
A. A line graph, with the time of day on the independent axis
B. A line graph, with the type of substrate on the dependent axis
C. A bar graph, with one bar for sand, one for silt, and one for coral, each subdivided by daylight versus night
D. A bar graph, with one bar for daylight and one for a night, each subdivided by substrate type
| SAND | SILT | CORAL | |
| Daylight | 15 | 10 | 13 |
| Night | 5 | 30 | 3 |
Answer
567.6k+ views
Hint:The given data states three different substrates and two different time periods. Both of these variables represent two different scales related to each other. Thus, to represent such data a mathematical representation for grouped data having rectangular bars is the appropriate method.
Complete answer:The data collected by the student represents two different variables on which the presence of fish is dependent. The two variables are the substrate and time of the day. To show how these two variables determine the fish presence can be represented using a bar graph. A bar graph represents two variables at individual scales. The bars in the graph are for the presence of fish based on daylight or night which is a dependent variable. Each of these bars then can be represented individually for a specific substrate. As the data given are grouped, a bar graph is the best way to explain it.

Fish are greatly watered adaptable species that can be found throughout the world’s oceans. The ocean floors are covered with different types of substrates that can be sand, silt, and corals. Sand is simply a granular material made of finely divided rock and mineral particles. Silt is also granular material that looks like sediment mixed in suspension with water as a solvent. Corals, on the other hand, are marine invertebrate organisms that occupy large seafloor areas and spread in colonies giving a home to thousands of fish. The substrates over which fish live and the 24-hour cycle has an important impact on fish behavior.
So, from the above discussion, we can conclude that the right answer is option D.
Note: The fish behavior is greatly varied by the environmental factors including the 24-hour cycle. The time of feeding, reproduction, breeding, etc. all depends on the time constraints. Most of the fish turn active at night as they feel more protected from their predators and collect their food.
Complete answer:The data collected by the student represents two different variables on which the presence of fish is dependent. The two variables are the substrate and time of the day. To show how these two variables determine the fish presence can be represented using a bar graph. A bar graph represents two variables at individual scales. The bars in the graph are for the presence of fish based on daylight or night which is a dependent variable. Each of these bars then can be represented individually for a specific substrate. As the data given are grouped, a bar graph is the best way to explain it.

Fish are greatly watered adaptable species that can be found throughout the world’s oceans. The ocean floors are covered with different types of substrates that can be sand, silt, and corals. Sand is simply a granular material made of finely divided rock and mineral particles. Silt is also granular material that looks like sediment mixed in suspension with water as a solvent. Corals, on the other hand, are marine invertebrate organisms that occupy large seafloor areas and spread in colonies giving a home to thousands of fish. The substrates over which fish live and the 24-hour cycle has an important impact on fish behavior.
So, from the above discussion, we can conclude that the right answer is option D.
Note: The fish behavior is greatly varied by the environmental factors including the 24-hour cycle. The time of feeding, reproduction, breeding, etc. all depends on the time constraints. Most of the fish turn active at night as they feel more protected from their predators and collect their food.
Recently Updated Pages
Master Class 7 English: Engaging Questions & Answers for Success

Master Class 7 Maths: Engaging Questions & Answers for Success

Master Class 7 Science: Engaging Questions & Answers for Success

Class 7 Question and Answer - Your Ultimate Solutions Guide

Master Class 9 General Knowledge: Engaging Questions & Answers for Success

Master Class 9 Social Science: Engaging Questions & Answers for Success

Trending doubts
The value of 6 more than 7 is A 1 B 1 C 13 D 13 class 7 maths CBSE

Convert 200 Million dollars in rupees class 7 maths CBSE

List of coprime numbers from 1 to 100 class 7 maths CBSE

AIM To prepare stained temporary mount of onion peel class 7 biology CBSE

The plural of Chief is Chieves A True B False class 7 english CBSE

Write a letter to the editor of the national daily class 7 english CBSE


