


What is the shape of the graph \[{{r}^{2}}=-\cos \theta \]?
Answer
525.9k+ views
Hint: For solving this question you should know about the graph of \[-\cos \theta \] and the range of this graph. And in this question if we find the range of \[-\cos \theta \] then it will be \[\dfrac{\pi }{2}\] to \[\dfrac{3\pi }{2}\]. And if we plot the graph for this then it becomes a loop and the reason for the loop is because the values of \[-\cos \theta \] will always vary within the range of -1 to 1. And thus we get a looped shape for this.
Complete step by step answer:
According to our question we have to find the shape of the graph of \[{{r}^{2}}=-\cos \theta \].
If we want to make a graph for \[{{r}^{2}}=-\cos \theta \], then first we will find the range of \[-\cos \theta \].
If we see the graph of \[\cos \theta \], then:
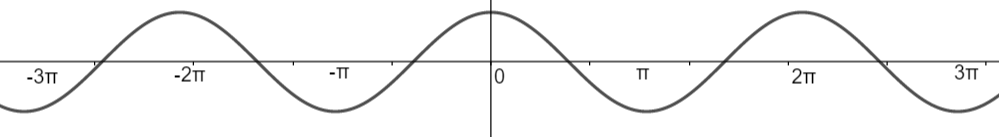
So, the range of cosine function is -1 to 1.
If we see to \[-\cos \theta \] then the range of \[-\cos \theta \] is \[-1\le -\cos \theta \le 1\] and the domain is \[\left( -\infty ,\infty \right),\left\{ \theta |\theta \in R \right\}\].
So, the graph of \[-\cos \theta \] is:
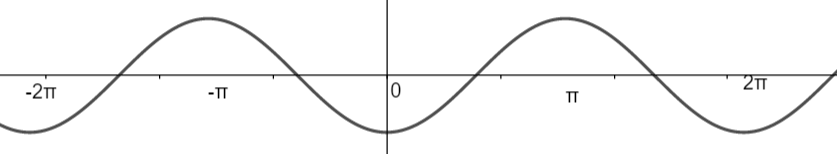
As per question \[{{r}^{2}}=-\cos \theta \], so the shape will be symmetrical about the initial line and \[{{r}^{2}}=-\cos \theta \ge 0,\theta \in \left( \dfrac{\pi }{2},\dfrac{3\pi }{2} \right)\], where \[\cos \theta \le 0\].
So, here if we see the value of \[-\cos \theta \] at different angles then:
At \[\dfrac{\pi }{2}:-\cos \theta =0;\left( 0,\dfrac{\pi }{2} \right)\]
At \[\dfrac{2\pi }{3}:-\cos \theta =\dfrac{1}{\sqrt{2}}:\left( \dfrac{1}{\sqrt{2}},\dfrac{2\pi }{3} \right)\]
At \[\dfrac{3\pi }{4}:-\cos \theta =\dfrac{1}{\sqrt{\sqrt{2}}};\left( \dfrac{1}{\sqrt{\sqrt{2}}},\dfrac{3\pi }{4} \right)\]
At \[\dfrac{5\pi }{6}:-\cos \theta =\sqrt{\dfrac{\sqrt{3}}{2}};\left( \sqrt{\dfrac{\sqrt{3}}{2}},\dfrac{5\pi }{6} \right)\]
At \[\pi :-\cos \theta =1;\left( 1,\pi \right)\]
Symmetry about the axis \[\theta =\pi \] will be used to draw the other half of the loop.
We considered only \[r=\sqrt{-\cos \theta }\ge \theta \] for making the loop we did not consider the non – positive \[r=\sqrt{-\cos \theta }\le \theta \], for the opposite loop, for the same \[\theta \in \left( \dfrac{\pi }{2},\dfrac{3\pi }{2} \right)\].
So, here the r is a single values function of \[\theta \].
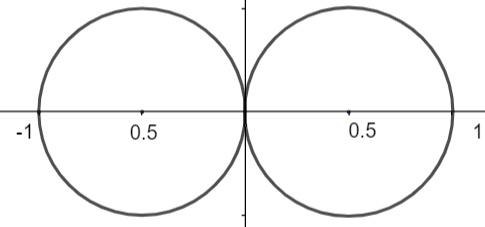
So, the shape of \[{{r}^{2}}=\left( -\cos \theta \right)\] is a looped shape.
Note: While solving this question you should be careful about the domain and the range of the given function because only these both will decide the graph of a function. And it will provide the shape. And the graph for every function is different from each other, so always draw a fresh new graph.
Complete step by step answer:
According to our question we have to find the shape of the graph of \[{{r}^{2}}=-\cos \theta \].
If we want to make a graph for \[{{r}^{2}}=-\cos \theta \], then first we will find the range of \[-\cos \theta \].
If we see the graph of \[\cos \theta \], then:
So, the range of cosine function is -1 to 1.
If we see to \[-\cos \theta \] then the range of \[-\cos \theta \] is \[-1\le -\cos \theta \le 1\] and the domain is \[\left( -\infty ,\infty \right),\left\{ \theta |\theta \in R \right\}\].
So, the graph of \[-\cos \theta \] is:
As per question \[{{r}^{2}}=-\cos \theta \], so the shape will be symmetrical about the initial line and \[{{r}^{2}}=-\cos \theta \ge 0,\theta \in \left( \dfrac{\pi }{2},\dfrac{3\pi }{2} \right)\], where \[\cos \theta \le 0\].
So, here if we see the value of \[-\cos \theta \] at different angles then:
At \[\dfrac{\pi }{2}:-\cos \theta =0;\left( 0,\dfrac{\pi }{2} \right)\]
At \[\dfrac{2\pi }{3}:-\cos \theta =\dfrac{1}{\sqrt{2}}:\left( \dfrac{1}{\sqrt{2}},\dfrac{2\pi }{3} \right)\]
At \[\dfrac{3\pi }{4}:-\cos \theta =\dfrac{1}{\sqrt{\sqrt{2}}};\left( \dfrac{1}{\sqrt{\sqrt{2}}},\dfrac{3\pi }{4} \right)\]
At \[\dfrac{5\pi }{6}:-\cos \theta =\sqrt{\dfrac{\sqrt{3}}{2}};\left( \sqrt{\dfrac{\sqrt{3}}{2}},\dfrac{5\pi }{6} \right)\]
At \[\pi :-\cos \theta =1;\left( 1,\pi \right)\]
Symmetry about the axis \[\theta =\pi \] will be used to draw the other half of the loop.
We considered only \[r=\sqrt{-\cos \theta }\ge \theta \] for making the loop we did not consider the non – positive \[r=\sqrt{-\cos \theta }\le \theta \], for the opposite loop, for the same \[\theta \in \left( \dfrac{\pi }{2},\dfrac{3\pi }{2} \right)\].
So, here the r is a single values function of \[\theta \].
So, the shape of \[{{r}^{2}}=\left( -\cos \theta \right)\] is a looped shape.
Note: While solving this question you should be careful about the domain and the range of the given function because only these both will decide the graph of a function. And it will provide the shape. And the graph for every function is different from each other, so always draw a fresh new graph.
Recently Updated Pages
Master Class 11 Computer Science: Engaging Questions & Answers for Success
Master Class 11 Business Studies: Engaging Questions & Answers for Success
Master Class 11 Economics: Engaging Questions & Answers for Success
Master Class 11 English: Engaging Questions & Answers for Success
Master Class 11 Maths: Engaging Questions & Answers for Success
Master Class 11 Biology: Engaging Questions & Answers for Success
Trending doubts
One Metric ton is equal to kg A 10000 B 1000 C 100 class 11 physics CBSE
There are 720 permutations of the digits 1 2 3 4 5 class 11 maths CBSE
Discuss the various forms of bacteria class 11 biology CBSE
Draw a diagram of a plant cell and label at least eight class 11 biology CBSE
State the laws of reflection of light
Explain zero factorial class 11 maths CBSE