Show graphically the intensity distribution in Fraunhofer’s single slit diffraction experiment. Label the axes.
Answer
584.4k+ views
Hint: When light passes through a single slit whose width ‘w’ is on the order of the wavelength of the light, then we can observe a single slit diffraction pattern on a screen that is a distance L away from the slit.
Complete answer:
Single slit diffraction is observed when light passes through a single slit whose width is in the order of the wavelength of the light. Diffraction of light is defined as the bending of the light around the corners such that it spreads out and illuminates areas where a shadow is expected. Since, diffraction and interference both occur simultaneously it is hard to separate them.

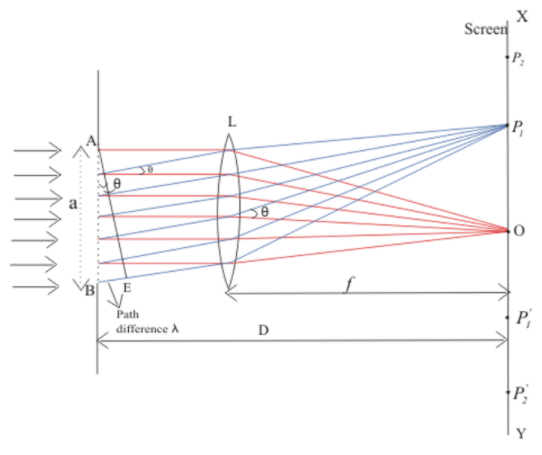
Let us assume that a parallel beam of light incident on a slit AB of width ‘a’ which is of order f the wavelength of light as shown in the figure. A real image of diffraction pattern is formed on the screen with the help of converging lenses placed in the path of the diffracted beam. All the rays which start from the slit AB in the same phase and produce brightness at point O on the axis of slit as they arrive in the same phase. Thus, the diffraction pattern on screen consists of a central bright band and alternate dark and bright bands of decreasing intensity on both sides.

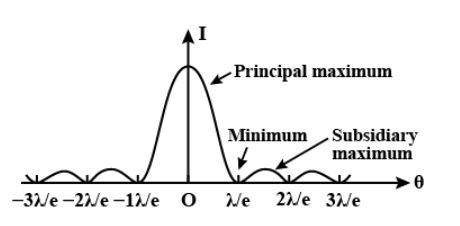
Hence, the above figure is the required graphical representation of variation of the intensity distribution with their distance from the centre of the central maxima.
Note:
Intensity of these secondary maxima is much less than central maxima and falls off as rapidly as it moves outwards. The central maxima lies between the minima and the width of the central maximum is the distance between the first order minima from the centre of the screen on both the sides of the centre.
Complete answer:
Single slit diffraction is observed when light passes through a single slit whose width is in the order of the wavelength of the light. Diffraction of light is defined as the bending of the light around the corners such that it spreads out and illuminates areas where a shadow is expected. Since, diffraction and interference both occur simultaneously it is hard to separate them.

Let us assume that a parallel beam of light incident on a slit AB of width ‘a’ which is of order f the wavelength of light as shown in the figure. A real image of diffraction pattern is formed on the screen with the help of converging lenses placed in the path of the diffracted beam. All the rays which start from the slit AB in the same phase and produce brightness at point O on the axis of slit as they arrive in the same phase. Thus, the diffraction pattern on screen consists of a central bright band and alternate dark and bright bands of decreasing intensity on both sides.

Hence, the above figure is the required graphical representation of variation of the intensity distribution with their distance from the centre of the central maxima.
Note:
Intensity of these secondary maxima is much less than central maxima and falls off as rapidly as it moves outwards. The central maxima lies between the minima and the width of the central maximum is the distance between the first order minima from the centre of the screen on both the sides of the centre.
Recently Updated Pages
Master Class 11 Computer Science: Engaging Questions & Answers for Success

Master Class 11 Business Studies: Engaging Questions & Answers for Success

Master Class 11 Economics: Engaging Questions & Answers for Success

Master Class 11 English: Engaging Questions & Answers for Success

Master Class 11 Maths: Engaging Questions & Answers for Success

Master Class 11 Biology: Engaging Questions & Answers for Success

Trending doubts
One Metric ton is equal to kg A 10000 B 1000 C 100 class 11 physics CBSE

There are 720 permutations of the digits 1 2 3 4 5 class 11 maths CBSE

Discuss the various forms of bacteria class 11 biology CBSE

Draw a diagram of a plant cell and label at least eight class 11 biology CBSE

State the laws of reflection of light

Explain zero factorial class 11 maths CBSE


