


How do you sketch a graph of a quadratic function that has x intercepts 0 and 4?
Answer
537k+ views
Hint: We must know that Parabola is a curve, whose equation is of the form; \[f\left( x \right) = a{x^2} + bx + c\] , which is the standard form of a parabola here a, b and c are the constants and x is the variable, here we are given with the x intercepts as 0 and 4, as intercepts of a graph are points at which the graph crosses the axes. Hence, to graph the equation, we have to find the vertex for the given equation and then plot with the given intercepts.
Formula used:
\[x = \dfrac{{ - b}}{{2a}}\]
Complete step by step solution:
If the x-intercepts are 0 and 4, then the quadratic equation is:
\[ \Rightarrow y = \left( {x - 0} \right) \times \left( {x - 4} \right)\]
\[ \Rightarrow y = x\left( {x - 4} \right)\]
As given, the points for the x-intercept are \[\left( {0,0} \right)\] and \[\left( {4,0} \right)\] .
Now,
\[y = {x^2} - 4x\] is a quadratic equation in standard form of \[y = a{x^2} + bx + c\] ;
In which we have,
\[a = 1,b = - 4,c = 0\]
To graph a quadratic equation, you need the vertex, y-intercept, x-intercepts, and one or two additional points.
We already have the x-intercepts as: \[\left( {0,0} \right)\] and \[\left( {4,0} \right)\] .
Vertex is the maximum or minimum point \[\left( {x,y} \right)\] of the parabola, hence to find the x-coordinate of the vertex, use the formula for the axis of symmetry given as:
\[x = \dfrac{{ - b}}{{2a}}\]
Now, substitute the value of a and b as:
\[ \Rightarrow x = \dfrac{{ - \left( { - 4} \right)}}{{2 \cdot 1}}\]
Simplifying we get:
\[ \Rightarrow x = \dfrac{4}{2}\]
\[ \Rightarrow x = 2\]
Now, to find the y-coordinate of the vertex, substitute the x-coordinate for x in the equation and solve for y as:
\[y = {x^2} - 4x\]
\[ \Rightarrow y = {2^2} - 4\left( 2 \right)\]
Simplifying the terms, we get:
\[ \Rightarrow y = 4 - 8\]
\[ \Rightarrow y = - 4\]
Therefore, the vertex is \[\left( {x,y} \right) = \left( {2, - 4} \right)\] .
We know that y-intercept is value of y when \[x = 0\] , hence substitute 0 for x and solve for y as:
\[y = {x^2} - 4x\]
\[ \Rightarrow y = {0^2} - 4\left( 0 \right)\]
\[ \Rightarrow y = 0\]
The y-intercept is \[\left( {0,0} \right)\] .
Now, let’s find the Additional points:
Choose values for x, substitute them into the equation, and solve for y.
Additional point 1: \[x = - 1\] .
\[y = {x^2} - 4x\]
\[ \Rightarrow y = {\left( { - 1} \right)^2} - 4\left( { - 1} \right)\]
Simplifying the terms, we get:
\[ \Rightarrow y = 1 + 4\]
\[ \Rightarrow y = 5\]
Hence, the first additional point is \[\left( { - 1,5} \right)\] .
Additional point 2: \[x = 5\] .
\[y = {x^2} - 4x\]
\[ \Rightarrow y = {5^2} - 4\left( 5 \right)\]
Simplifying the terms, we get:
\[ \Rightarrow y = 25 - 40\]
\[ \Rightarrow y = 5\]
Hence, the second additional point is \[\left( {5,5} \right)\] .
Therefore, the additional points are \[\left( { - 1,5} \right)\] and \[\left( {5,5} \right)\] .
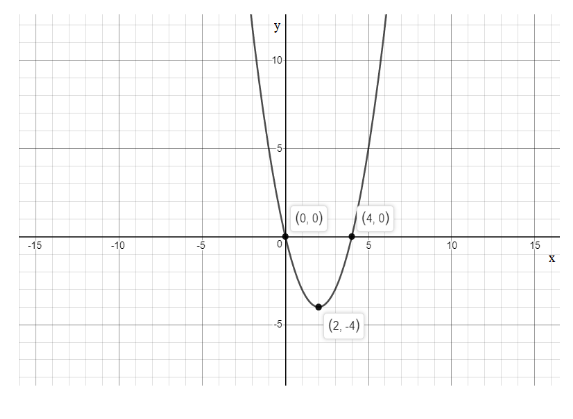
Now, to sketch the graph plot the points and sketch a parabola through the points as,
We have x-intercepts as \[\left( {0,0} \right)\] and \[\left( {4,0} \right)\] and the y-intercept as \[\left( {0,0} \right)\] and vertex is \[\left( {x,y} \right) = \left( {2, - 4} \right)\] .
Note: The key point to sketch a graph of a quadratic function that has x intercepts 0 and 4 is we need to find the intercepts points and its vertex and If the intercepts are not given, we need to find the x-intercept, set y = 0 and solve for x, to find the y-intercept, set x = 0 and solve for y hence by solving we get the x and y intercepts and to graph a line, graph the points if they exist, and then connect the two points with a straight line.
Formula used:
\[x = \dfrac{{ - b}}{{2a}}\]
Complete step by step solution:
If the x-intercepts are 0 and 4, then the quadratic equation is:
\[ \Rightarrow y = \left( {x - 0} \right) \times \left( {x - 4} \right)\]
\[ \Rightarrow y = x\left( {x - 4} \right)\]
As given, the points for the x-intercept are \[\left( {0,0} \right)\] and \[\left( {4,0} \right)\] .
Now,
\[y = {x^2} - 4x\] is a quadratic equation in standard form of \[y = a{x^2} + bx + c\] ;
In which we have,
\[a = 1,b = - 4,c = 0\]
To graph a quadratic equation, you need the vertex, y-intercept, x-intercepts, and one or two additional points.
We already have the x-intercepts as: \[\left( {0,0} \right)\] and \[\left( {4,0} \right)\] .
Vertex is the maximum or minimum point \[\left( {x,y} \right)\] of the parabola, hence to find the x-coordinate of the vertex, use the formula for the axis of symmetry given as:
\[x = \dfrac{{ - b}}{{2a}}\]
Now, substitute the value of a and b as:
\[ \Rightarrow x = \dfrac{{ - \left( { - 4} \right)}}{{2 \cdot 1}}\]
Simplifying we get:
\[ \Rightarrow x = \dfrac{4}{2}\]
\[ \Rightarrow x = 2\]
Now, to find the y-coordinate of the vertex, substitute the x-coordinate for x in the equation and solve for y as:
\[y = {x^2} - 4x\]
\[ \Rightarrow y = {2^2} - 4\left( 2 \right)\]
Simplifying the terms, we get:
\[ \Rightarrow y = 4 - 8\]
\[ \Rightarrow y = - 4\]
Therefore, the vertex is \[\left( {x,y} \right) = \left( {2, - 4} \right)\] .
We know that y-intercept is value of y when \[x = 0\] , hence substitute 0 for x and solve for y as:
\[y = {x^2} - 4x\]
\[ \Rightarrow y = {0^2} - 4\left( 0 \right)\]
\[ \Rightarrow y = 0\]
The y-intercept is \[\left( {0,0} \right)\] .
Now, let’s find the Additional points:
Choose values for x, substitute them into the equation, and solve for y.
Additional point 1: \[x = - 1\] .
\[y = {x^2} - 4x\]
\[ \Rightarrow y = {\left( { - 1} \right)^2} - 4\left( { - 1} \right)\]
Simplifying the terms, we get:
\[ \Rightarrow y = 1 + 4\]
\[ \Rightarrow y = 5\]
Hence, the first additional point is \[\left( { - 1,5} \right)\] .
Additional point 2: \[x = 5\] .
\[y = {x^2} - 4x\]
\[ \Rightarrow y = {5^2} - 4\left( 5 \right)\]
Simplifying the terms, we get:
\[ \Rightarrow y = 25 - 40\]
\[ \Rightarrow y = 5\]
Hence, the second additional point is \[\left( {5,5} \right)\] .
Therefore, the additional points are \[\left( { - 1,5} \right)\] and \[\left( {5,5} \right)\] .
Now, to sketch the graph plot the points and sketch a parabola through the points as,
We have x-intercepts as \[\left( {0,0} \right)\] and \[\left( {4,0} \right)\] and the y-intercept as \[\left( {0,0} \right)\] and vertex is \[\left( {x,y} \right) = \left( {2, - 4} \right)\] .
Note: The key point to sketch a graph of a quadratic function that has x intercepts 0 and 4 is we need to find the intercepts points and its vertex and If the intercepts are not given, we need to find the x-intercept, set y = 0 and solve for x, to find the y-intercept, set x = 0 and solve for y hence by solving we get the x and y intercepts and to graph a line, graph the points if they exist, and then connect the two points with a straight line.

Recently Updated Pages
Master Class 8 Social Science: Engaging Questions & Answers for Success
Master Class 8 English: Engaging Questions & Answers for Success
Class 8 Question and Answer - Your Ultimate Solutions Guide
Master Class 8 Maths: Engaging Questions & Answers for Success
Master Class 8 Science: Engaging Questions & Answers for Success
Master Class 9 General Knowledge: Engaging Questions & Answers for Success
Trending doubts
What is BLO What is the full form of BLO class 8 social science CBSE
Citizens of India can vote at the age of A 18 years class 8 social science CBSE
Full form of STD, ISD and PCO
Advantages and disadvantages of science
Right to vote is a AFundamental Right BFundamental class 8 social science CBSE
What are the 12 elements of nature class 8 chemistry CBSE