


Sketch the graph for $ y = {\tan ^{ - 1}}(\tan x) $
Answer
570.9k+ views
Hint:
To sketch the graph of $ y = {\tan ^{ - 1}}(\tan x) $ . First, we have to calculate the domain and range of tanx and $ {\tan ^{ - 1}} $ . From this, we can sketch the graph of $ \tan x $ and $ {\tan ^{ - 1}} $ . With the help of these, we can draw a graph of $ y = {\tan ^{ - 1}}(\tan x) $
In a relation R from set A to set B, the set of all first components of order pair belongings to R is called the domain and all the second element of pair is called range.
Complete step by step solution:
We know that the domain of tan. function(tangent function) is the set $ \left\{ {x:x \in R,and.x \ne (2n + 1)\dfrac{\pi }{2},n \in Z} \right\} $
here R represents the real number and $ x \ne (2n + 1)\dfrac{\pi }{2} $ means the domain of tan function does not contain an odd multiple of $ \dfrac{\pi }{2} $ . $ n \in Z $ Represents that n is an integer. Z is the symbol of an integer.
The range of the tan function in R. Here R represents the real number. If we restrict the domain of a tangent function to $ \left( {\dfrac{{ - \pi }}{2},\dfrac{\pi }{2}} \right) $ then it is one-one and onto with the range R. So, the tangent function is restricted to any of interval etc, is bijective and range is R. SO, $ {\tan ^{ - 1}} $ can be defined as the function whose domain is R and range could be any of interval $ \left( {\dfrac{{ - 3\pi }}{2},\dfrac{\pi }{2}} \right),\left( {\dfrac{{ - \pi }}{2},\dfrac{\pi }{2}} \right),\left( {\dfrac{\pi }{2},\dfrac{{3\pi }}{2}} \right) $ and so on. This interval gives different branches of the function $ {\tan ^{ - 1}} $ . The branch $ \left( {\dfrac{{ - \pi }}{2},\dfrac{\pi }{2}} \right) $ is called the principal value branch of the function $ {\tan ^{ - 1}} $ therefor $ {\tan ^{ - 1}}:R \to \left( {\dfrac{{ - \pi }}{2},\dfrac{\pi }{2}} \right) $
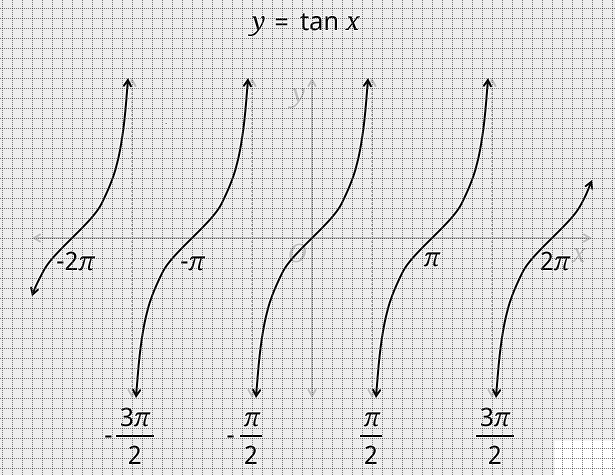
The graph of a tan function $ y = \tan x $ is given as:
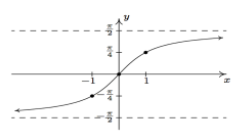
The graph of $ y = {\tan ^{ - 1}}x $ is given as
As $ y = {\tan ^{ - 1}}(\tan x) $ is periodic with period π. therefore to draw this graph we should draw the graph for one interval $ \pi $ and repeat for the entire value.
As we know that $ y = {\tan ^{ - 1}}(\tan x) $ = $ \left\{ {x:\dfrac{\pi }{2} < x < \dfrac{\pi }{2}} \right\} $
This has been defined for $ \dfrac{\pi }{2} < x < \dfrac{\pi }{2} $ that has a length $ \pi $ so its graph could be plotted as
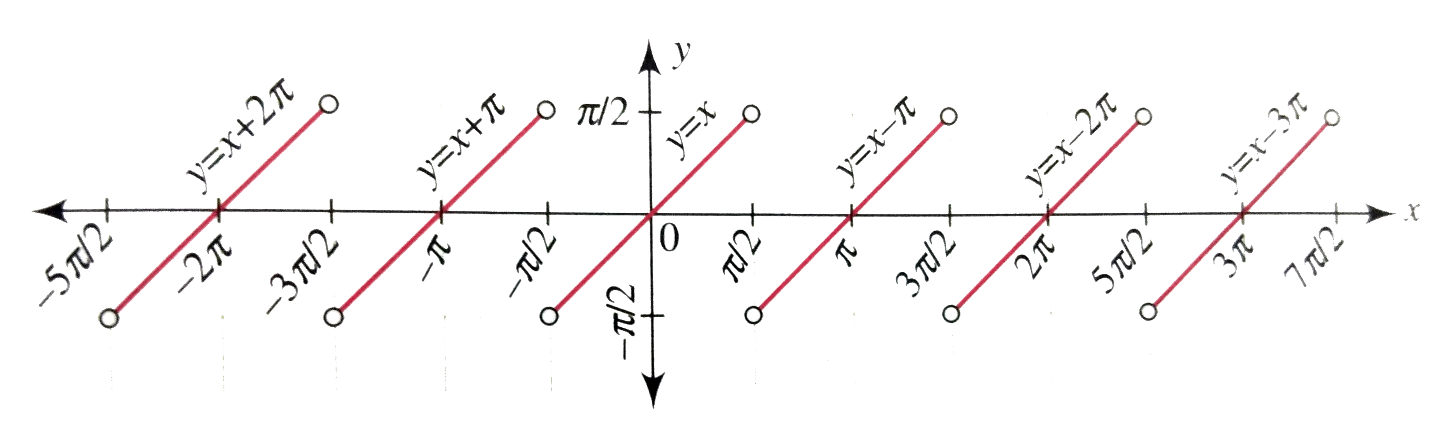
Thus this graph of y where y is not defined for $ x \in (2n + 1)\dfrac{\pi }{2} $ .
Note:
One-one function: A function $ f:x \to y $ is defined as a one-one function of the image of distinct elements of X under $ f $ are distinct.
Onto function: A function is $ f:x \to y $ said to be onto the function of every element of Y is an image of some element of X under f.
Bijective Function: The function which is both one-one and onto is called the bijective function.
To sketch the graph of $ y = {\tan ^{ - 1}}(\tan x) $ . First, we have to calculate the domain and range of tanx and $ {\tan ^{ - 1}} $ . From this, we can sketch the graph of $ \tan x $ and $ {\tan ^{ - 1}} $ . With the help of these, we can draw a graph of $ y = {\tan ^{ - 1}}(\tan x) $
In a relation R from set A to set B, the set of all first components of order pair belongings to R is called the domain and all the second element of pair is called range.
Complete step by step solution:
We know that the domain of tan. function(tangent function) is the set $ \left\{ {x:x \in R,and.x \ne (2n + 1)\dfrac{\pi }{2},n \in Z} \right\} $
here R represents the real number and $ x \ne (2n + 1)\dfrac{\pi }{2} $ means the domain of tan function does not contain an odd multiple of $ \dfrac{\pi }{2} $ . $ n \in Z $ Represents that n is an integer. Z is the symbol of an integer.
The range of the tan function in R. Here R represents the real number. If we restrict the domain of a tangent function to $ \left( {\dfrac{{ - \pi }}{2},\dfrac{\pi }{2}} \right) $ then it is one-one and onto with the range R. So, the tangent function is restricted to any of interval etc, is bijective and range is R. SO, $ {\tan ^{ - 1}} $ can be defined as the function whose domain is R and range could be any of interval $ \left( {\dfrac{{ - 3\pi }}{2},\dfrac{\pi }{2}} \right),\left( {\dfrac{{ - \pi }}{2},\dfrac{\pi }{2}} \right),\left( {\dfrac{\pi }{2},\dfrac{{3\pi }}{2}} \right) $ and so on. This interval gives different branches of the function $ {\tan ^{ - 1}} $ . The branch $ \left( {\dfrac{{ - \pi }}{2},\dfrac{\pi }{2}} \right) $ is called the principal value branch of the function $ {\tan ^{ - 1}} $ therefor $ {\tan ^{ - 1}}:R \to \left( {\dfrac{{ - \pi }}{2},\dfrac{\pi }{2}} \right) $
The graph of a tan function $ y = \tan x $ is given as:
The graph of $ y = {\tan ^{ - 1}}x $ is given as
As $ y = {\tan ^{ - 1}}(\tan x) $ is periodic with period π. therefore to draw this graph we should draw the graph for one interval $ \pi $ and repeat for the entire value.
As we know that $ y = {\tan ^{ - 1}}(\tan x) $ = $ \left\{ {x:\dfrac{\pi }{2} < x < \dfrac{\pi }{2}} \right\} $
This has been defined for $ \dfrac{\pi }{2} < x < \dfrac{\pi }{2} $ that has a length $ \pi $ so its graph could be plotted as
Thus this graph of y where y is not defined for $ x \in (2n + 1)\dfrac{\pi }{2} $ .
Note:
One-one function: A function $ f:x \to y $ is defined as a one-one function of the image of distinct elements of X under $ f $ are distinct.
Onto function: A function is $ f:x \to y $ said to be onto the function of every element of Y is an image of some element of X under f.
Bijective Function: The function which is both one-one and onto is called the bijective function.
Recently Updated Pages
Master Class 11 Computer Science: Engaging Questions & Answers for Success
Master Class 11 Business Studies: Engaging Questions & Answers for Success
Master Class 11 Economics: Engaging Questions & Answers for Success
Master Class 11 English: Engaging Questions & Answers for Success
Master Class 11 Maths: Engaging Questions & Answers for Success
Master Class 11 Biology: Engaging Questions & Answers for Success
Trending doubts
There are 720 permutations of the digits 1 2 3 4 5 class 11 maths CBSE
Discuss the various forms of bacteria class 11 biology CBSE
Explain zero factorial class 11 maths CBSE
What organs are located on the left side of your body class 11 biology CBSE
Draw a diagram of nephron and explain its structur class 11 biology CBSE
How do I convert ms to kmh Give an example class 11 physics CBSE