What is the slope of a graph? What information does the slope of the graph give us in the x-t and v-t graph?
Answer
571.5k+ views
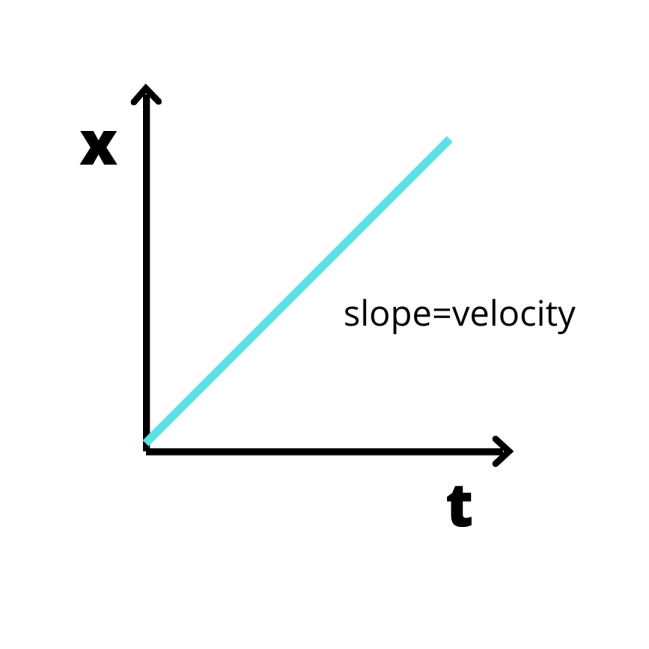
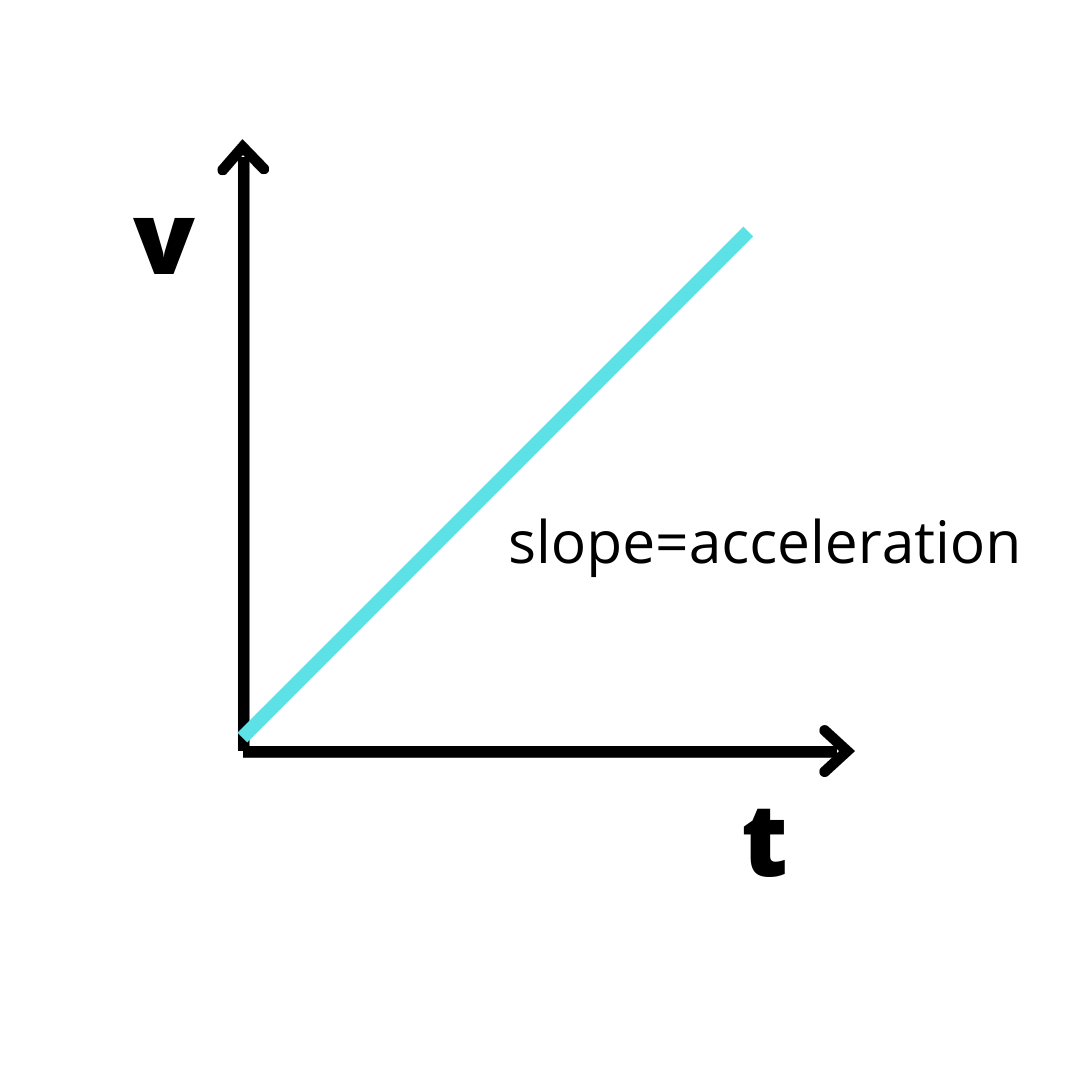
Hint: The slope of position time graph x-t graph gives us the information about the velocity of the body. The slope of velocity time graph v-t graph gives us the information about the acceleration of the body.
Complete step by step answer:
The slope of a graph is a very important characteristic of a graph, whether we are talking about x- t graph, or we are talking about v-t graph. But to define the slope, we will be saying that the ratio of difference between two y coordinates to the difference of x coordinates is called slope. It tells us about how the line is changing with the change in the coordinates, i.e. is it steep or straight.
\[slope = \dfrac{{{y_2} - {y_1}}}{{{x_2} - {x_1}}}\].
Also with reference to x-t and v-t graph it is considered with high importance as it tells about the change in motion of the body.
Now, in case of x-t graph,
As x represents the displacement moved and t is the time taken to travel the distance.
So according to basic definition of the slope of graph we can say
$
slope = \dfrac{{{x_2} - {x_1}}}{{{t_2} - {t_1}}} \\
\\
$
Where ${x_2} - {x_1}$ is the displacement travelled by the object and ${t_2} - {t_1}$ is the time taken
From the definition of velocity, we say velocity is distance travelled in given the time by the body.
$v = \dfrac{d}{t}$
Replacing the values with displacement ${x_2} - {x_1}$ and time ${t_2} - {t_1}$
We get,
$v = \dfrac{{{x_2} - {x_1}}}{{{t_2} - {t_1}}}$
This is simply equal to the slope of the x-t graph. Therefore, x- t graph tells us about the velocity of an object.

Now, in case of v-t graph,
As v represents the velocity of the object and t is time taken by the object.
So according to basic definition of the slope of graph we can say
$
slope = \dfrac{{{x_2} - {x_1}}}{{{t_2} - {t_1}}} \\
\\
$
We can say
$slope = \dfrac{{{v_2} - {v_1}}}{{{t_2} - {t_1}}}$
Here ${v_2} - {v_1}$is the change in the velocity
And ${t_2} - {t_1}$ is the time taken to change the velocity
From the definition of acceleration, we can say
$a = \dfrac{v}{t}$
Which is basically equal to change in velocity of the object in the given time t.
As acceleration is defined as the change in the velocity of the object in the given time.
We can write
$a = \dfrac{{{v_2} - {v_1}}}{{{t_2} - {t_1}}}$
This is simply equal to slope of the v-t graph.
Therefore, the v-t graph tells us about the acceleration of the object.

Note:The concept of change in motion is required to be understood very well. As x-t graphs there is change in velocity, so the slope tells us about the velocity. In the v-t graph, there is change in the acceleration so the slope tells us about the acceleration of the object.
Complete step by step answer:
The slope of a graph is a very important characteristic of a graph, whether we are talking about x- t graph, or we are talking about v-t graph. But to define the slope, we will be saying that the ratio of difference between two y coordinates to the difference of x coordinates is called slope. It tells us about how the line is changing with the change in the coordinates, i.e. is it steep or straight.
\[slope = \dfrac{{{y_2} - {y_1}}}{{{x_2} - {x_1}}}\].
Also with reference to x-t and v-t graph it is considered with high importance as it tells about the change in motion of the body.
Now, in case of x-t graph,
As x represents the displacement moved and t is the time taken to travel the distance.
So according to basic definition of the slope of graph we can say
$
slope = \dfrac{{{x_2} - {x_1}}}{{{t_2} - {t_1}}} \\
\\
$
Where ${x_2} - {x_1}$ is the displacement travelled by the object and ${t_2} - {t_1}$ is the time taken
From the definition of velocity, we say velocity is distance travelled in given the time by the body.
$v = \dfrac{d}{t}$
Replacing the values with displacement ${x_2} - {x_1}$ and time ${t_2} - {t_1}$
We get,
$v = \dfrac{{{x_2} - {x_1}}}{{{t_2} - {t_1}}}$
This is simply equal to the slope of the x-t graph. Therefore, x- t graph tells us about the velocity of an object.

Now, in case of v-t graph,
As v represents the velocity of the object and t is time taken by the object.
So according to basic definition of the slope of graph we can say
$
slope = \dfrac{{{x_2} - {x_1}}}{{{t_2} - {t_1}}} \\
\\
$
We can say
$slope = \dfrac{{{v_2} - {v_1}}}{{{t_2} - {t_1}}}$
Here ${v_2} - {v_1}$is the change in the velocity
And ${t_2} - {t_1}$ is the time taken to change the velocity
From the definition of acceleration, we can say
$a = \dfrac{v}{t}$
Which is basically equal to change in velocity of the object in the given time t.
As acceleration is defined as the change in the velocity of the object in the given time.
We can write
$a = \dfrac{{{v_2} - {v_1}}}{{{t_2} - {t_1}}}$
This is simply equal to slope of the v-t graph.
Therefore, the v-t graph tells us about the acceleration of the object.

Note:The concept of change in motion is required to be understood very well. As x-t graphs there is change in velocity, so the slope tells us about the velocity. In the v-t graph, there is change in the acceleration so the slope tells us about the acceleration of the object.
Recently Updated Pages
Master Class 11 Computer Science: Engaging Questions & Answers for Success

Master Class 11 Business Studies: Engaging Questions & Answers for Success

Master Class 11 Economics: Engaging Questions & Answers for Success

Master Class 11 English: Engaging Questions & Answers for Success

Master Class 11 Maths: Engaging Questions & Answers for Success

Master Class 11 Biology: Engaging Questions & Answers for Success

Trending doubts
One Metric ton is equal to kg A 10000 B 1000 C 100 class 11 physics CBSE

There are 720 permutations of the digits 1 2 3 4 5 class 11 maths CBSE

Discuss the various forms of bacteria class 11 biology CBSE

Draw a diagram of a plant cell and label at least eight class 11 biology CBSE

State the laws of reflection of light

Explain zero factorial class 11 maths CBSE


