


STATEMENT-1: Mode of a distribution can be obtained from Ogives.
STATEMENT-2: Mode of a frequency can be obtained from a frequency polygon.
(A) Statement-1 is True, Statement-2 is True, Statement-2 is a correct explanation for Statement-1.
(B) Statement-1 is True, Statement-2 is True, Statement-2 is not a correct explanation for Statement-1.
(B) Statement-1 is True, Statement-2 is False
(B) Statement-1 is False, Statement-2 is True.
Answer
581.7k+ views
Hint: We solve this question by first considering the statement 1. Then we go through the definition of ogives and what it represents and find whether the given statement is true or false. Then we consider the second statement and go through the definition of frequency polygon and find if the statement 2 is true or not. Then we choose the option satisfying the obtained answers.
Complete step by step answer:
Let us consider the Statement 1, mode of a distribution can be obtained from ogives.
An ogive is the graph of a cumulative frequency distribution. We create an ogive by plotting the points corresponding to the cumulative frequency of each interval.
There are two methods for drawing an ogive. They are
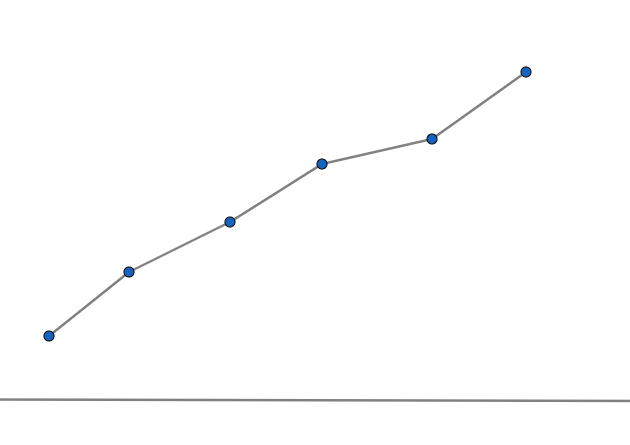
1) Less than ogive
It is drawn using the less than cumulative frequency, that is sum of frequencies of all preceding classes to every class.
It looks like,
2) Greater than ogive
It is drawn using the greater than cumulative frequency, that is sum of frequencies of all succeeding classes to every class.
It looks like,

Now let us take both the ogives combined.
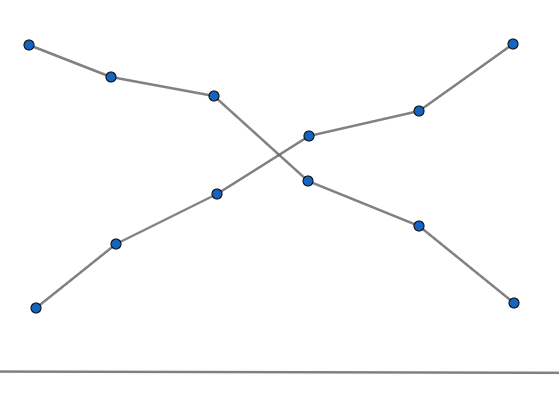
The above point of intersection is the median of the frequency distribution.
So, as the given statement 1 is, Mode of a distribution can be obtained from Ogives.
But as we discussed, from the ogives, we get the value of median and mode.
So, we can say that statement 1 is false.
Now let us consider the statement 2, mode of a frequency can be obtained from a frequency polygon.
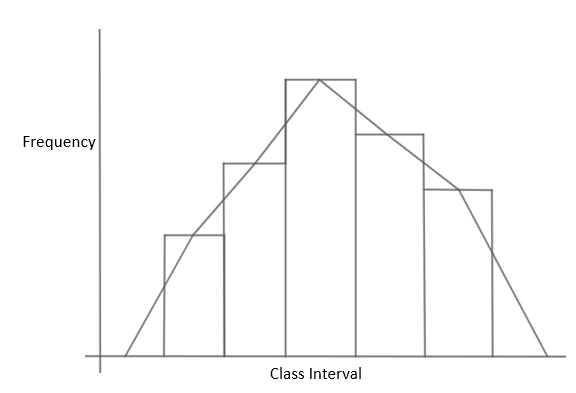
A frequency polygon is the graph constructed by using lines to join the midpoints of each interval. It looks as below,
We can find the mode from this graph by finding the point of intersection of the line drawn below.
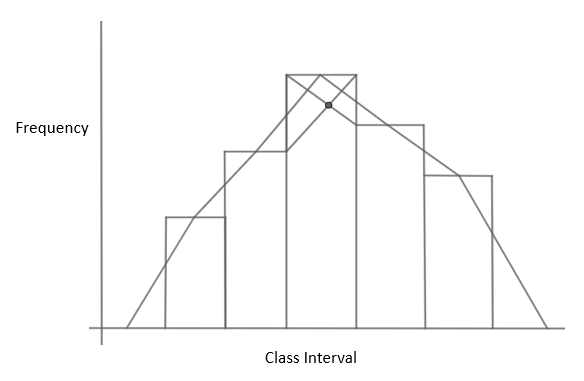
So, we can find the mode from the frequency polygon. Hence statement 2 is true.
Hence, we get that Statement-1 is False and Statement-2 is True.
So, the correct answer is “Option D”.
Note: While solving this problem, after finding that the statement-1 is false, it is enough to answer the question as Option D is the only option with statement 1 as false. So, we need not check statement 2 as we can answer the question directly by checking the statement 1 here.
Complete step by step answer:
Let us consider the Statement 1, mode of a distribution can be obtained from ogives.
An ogive is the graph of a cumulative frequency distribution. We create an ogive by plotting the points corresponding to the cumulative frequency of each interval.
There are two methods for drawing an ogive. They are
1) Less than ogive
It is drawn using the less than cumulative frequency, that is sum of frequencies of all preceding classes to every class.
It looks like,
2) Greater than ogive
It is drawn using the greater than cumulative frequency, that is sum of frequencies of all succeeding classes to every class.
It looks like,
Now let us take both the ogives combined.
The above point of intersection is the median of the frequency distribution.
So, as the given statement 1 is, Mode of a distribution can be obtained from Ogives.
But as we discussed, from the ogives, we get the value of median and mode.
So, we can say that statement 1 is false.
Now let us consider the statement 2, mode of a frequency can be obtained from a frequency polygon.
A frequency polygon is the graph constructed by using lines to join the midpoints of each interval. It looks as below,
We can find the mode from this graph by finding the point of intersection of the line drawn below.
So, we can find the mode from the frequency polygon. Hence statement 2 is true.
Hence, we get that Statement-1 is False and Statement-2 is True.
So, the correct answer is “Option D”.
Note: While solving this problem, after finding that the statement-1 is false, it is enough to answer the question as Option D is the only option with statement 1 as false. So, we need not check statement 2 as we can answer the question directly by checking the statement 1 here.
Recently Updated Pages
Master Class 10 Computer Science: Engaging Questions & Answers for Success
Master Class 10 General Knowledge: Engaging Questions & Answers for Success
Master Class 10 English: Engaging Questions & Answers for Success
Master Class 10 Social Science: Engaging Questions & Answers for Success
Master Class 10 Maths: Engaging Questions & Answers for Success
Master Class 10 Science: Engaging Questions & Answers for Success
Trending doubts
What is the median of the first 10 natural numbers class 10 maths CBSE
Which women's tennis player has 24 Grand Slam singles titles?
Who is the Brand Ambassador of Incredible India?
Why is there a time difference of about 5 hours between class 10 social science CBSE
Write a letter to the principal requesting him to grant class 10 english CBSE
State and prove converse of BPT Basic Proportionality class 10 maths CBSE