


Study the bar graph given below and answer the questions that follow:
(a) What information is depicted from the bar graph?
(b) In which subject is the student very good?
(c) Calculate the average marks of the student.
(d) If 75 and above marks denote a distinction, then name the subjects in which the student got distinction.
(e) Calculate the percentage of marks the student got out of 500.
Answer
518.1k+ views
Hint: Bar graphs are the pictorial representation of data, in the form of vertical or horizontal rectangular bars, where the length of bars are proportional to the measure of data. Let us answer each of the given questions. From the label of X-axis and Y-axis, we can find the answer of (a). From the length of the bar and the corresponding values, we can get the answer of (b). To find the average marks of the student, we have to divide the sum of the marks obtained in all the subjects by the total number of subjects. Reading the bar graph carefully gives the answer of (d). To find the percentage of marks the student got out of 500, we have to divide the total marks that the student obtained by 500 and find the percentage by multiplying the result by 100.
Complete step by step solution:
We know that bar graphs are the pictorial representation of data, in the form of vertical or horizontal rectangular bars, where the length of bars are proportional to the measure of data. Let us answer each of the given questions.
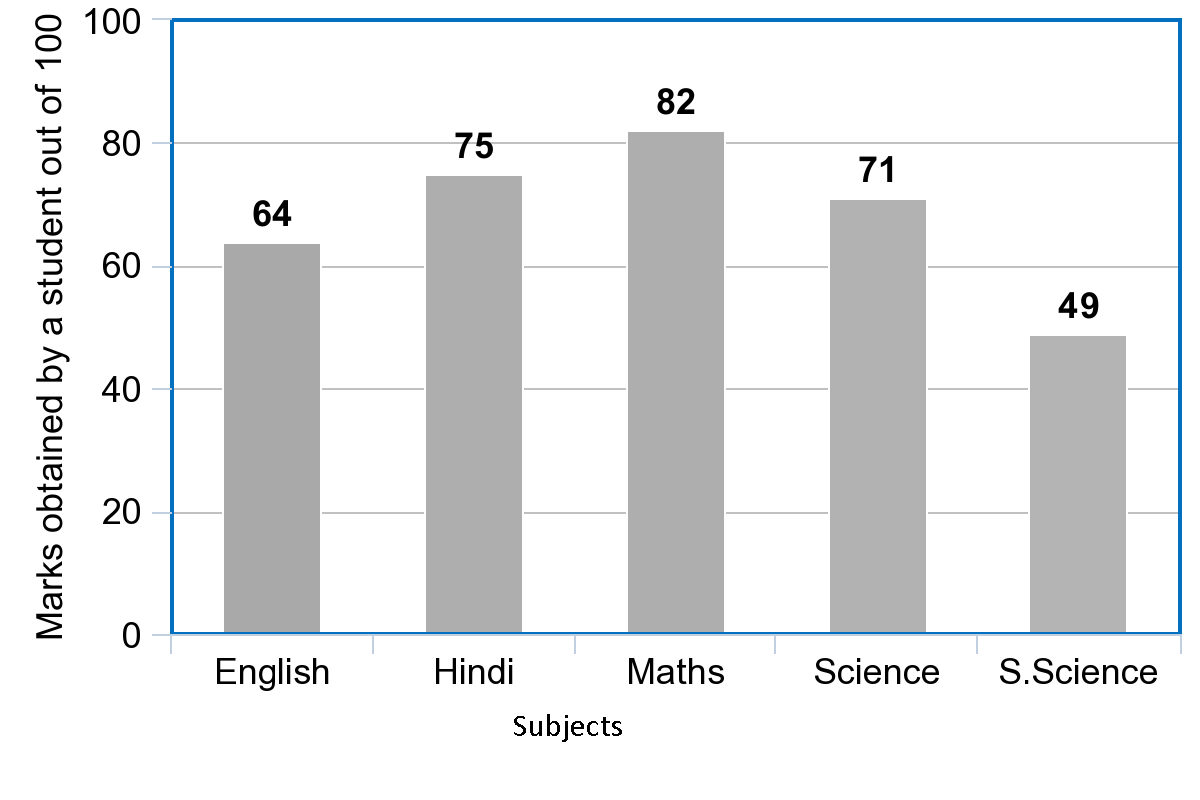
(a) From the given bar graph, we can see that it depicts the marks (out of 100) obtained by a student in 5 subjects.
(b) From the bar graph, we can see that the student scored 64 marks in English, 75 marks in Hindi, 82 marks in Maths, 71 marks in Science and 49 marks in Social Science. The student obtained highest mark in Maths with a score of 82. Therefore, the student is good in Maths.
(c) We have to calculate the average marks of the student. We know that average value of a data is the sum of all the values divided by the total number of value. Let us add the marks obtained by the student in all the 5 subjects.
Sum of the marks $=64+75+82+71+49=341$
We know that total number of subjects = 5.
Therefore, average marks of the student is given by
$\begin{align}
& \Rightarrow \text{Average marks of the student}=\dfrac{\text{Sum of all the marks}}{\text{Total number of subjects}} \\
& \Rightarrow \text{Average marks of the student}=\dfrac{341}{5} \\
\end{align}$
We have to divide 341 by 5.
$\Rightarrow \text{Average marks of the student}=68.2$
Therefore, the average marks of the student is 68.2.
(d) We are given that 75 and above marks denote a distinction. The subjects in which the student scored above 75 are Hindi and Maths with a mark of 75 and 82 respectively. Therefore, the subjects in which the student got distinction are Hindi and Maths.
(e) We have to calculate the percentage of marks the student got out of 500. For this, we have to divide the total marks that the student obtained by 500 and find the percentage by multiplying the result by 100.
$\Rightarrow \dfrac{341}{500}\times 100\%$
Let us cancel the zeroes from the numerator and the denominator.
$\Rightarrow \dfrac{341}{5\require{cancel}\cancel{0}\require{cancel}\cancel{0}}\times 1\require{cancel}\cancel{0}\require{cancel}\cancel{0}\%$
We can write the above simplification as
$\begin{align}
& \Rightarrow \dfrac{341}{5}\% \\
& =68.2\% \\
\end{align}$
Note: Students must read the bar graph very carefully. When finding the average marks, they have a chance of making mistake by writing the average marks as $\text{Average marks of the student}=\dfrac{\text{Total number of subjects}}{\text{Sum of all the marks}}$ . Students must consider the value 75 when finding the subjects that the student obtained distinction. Also, when finding the percentage, the total number of marks is considered as 500.
Complete step by step solution:
We know that bar graphs are the pictorial representation of data, in the form of vertical or horizontal rectangular bars, where the length of bars are proportional to the measure of data. Let us answer each of the given questions.
(a) From the given bar graph, we can see that it depicts the marks (out of 100) obtained by a student in 5 subjects.
(b) From the bar graph, we can see that the student scored 64 marks in English, 75 marks in Hindi, 82 marks in Maths, 71 marks in Science and 49 marks in Social Science. The student obtained highest mark in Maths with a score of 82. Therefore, the student is good in Maths.
(c) We have to calculate the average marks of the student. We know that average value of a data is the sum of all the values divided by the total number of value. Let us add the marks obtained by the student in all the 5 subjects.
Sum of the marks $=64+75+82+71+49=341$
We know that total number of subjects = 5.
Therefore, average marks of the student is given by
$\begin{align}
& \Rightarrow \text{Average marks of the student}=\dfrac{\text{Sum of all the marks}}{\text{Total number of subjects}} \\
& \Rightarrow \text{Average marks of the student}=\dfrac{341}{5} \\
\end{align}$
We have to divide 341 by 5.
$\Rightarrow \text{Average marks of the student}=68.2$
Therefore, the average marks of the student is 68.2.
(d) We are given that 75 and above marks denote a distinction. The subjects in which the student scored above 75 are Hindi and Maths with a mark of 75 and 82 respectively. Therefore, the subjects in which the student got distinction are Hindi and Maths.
(e) We have to calculate the percentage of marks the student got out of 500. For this, we have to divide the total marks that the student obtained by 500 and find the percentage by multiplying the result by 100.
$\Rightarrow \dfrac{341}{500}\times 100\%$
Let us cancel the zeroes from the numerator and the denominator.
$\Rightarrow \dfrac{341}{5\require{cancel}\cancel{0}\require{cancel}\cancel{0}}\times 1\require{cancel}\cancel{0}\require{cancel}\cancel{0}\%$
We can write the above simplification as
$\begin{align}
& \Rightarrow \dfrac{341}{5}\% \\
& =68.2\% \\
\end{align}$
Note: Students must read the bar graph very carefully. When finding the average marks, they have a chance of making mistake by writing the average marks as $\text{Average marks of the student}=\dfrac{\text{Total number of subjects}}{\text{Sum of all the marks}}$ . Students must consider the value 75 when finding the subjects that the student obtained distinction. Also, when finding the percentage, the total number of marks is considered as 500.
Recently Updated Pages
Master Class 10 Computer Science: Engaging Questions & Answers for Success
Master Class 10 General Knowledge: Engaging Questions & Answers for Success
Master Class 10 English: Engaging Questions & Answers for Success
Master Class 10 Social Science: Engaging Questions & Answers for Success
Master Class 10 Maths: Engaging Questions & Answers for Success
Master Class 10 Science: Engaging Questions & Answers for Success
Trending doubts
What is the median of the first 10 natural numbers class 10 maths CBSE
Which women's tennis player has 24 Grand Slam singles titles?
Who is the Brand Ambassador of Incredible India?
Why is there a time difference of about 5 hours between class 10 social science CBSE
Write a letter to the principal requesting him to grant class 10 english CBSE
A moving boat is observed from the top of a 150 m high class 10 maths CBSE